
Assessment Summary
0 of 78 Questions completed
Questions:
Information

You have already completed the assessment before. Hence you can not start it again.
Assessment is loading…
You must sign in or sign up to start the assessment.
You must first complete the following:
Results
YOUR RESULTS
0 / 78 Questions Correct!
Time:
Time has elapsed
You have reached 0 of 0 point(s), (0)
Earned Point(s): 0 of 0, (0)
0 Essay(s) Pending (Possible Point(s): 0)
Categories
- Not categorized 0%


- 1
- 2
- 3
- 4
- 5
- 6
- 7
- 8
- 9
- 10
- 11
- 12
- 13
- 14
- 15
- 16
- 17
- 18
- 19
- 20
- 21
- 22
- 23
- 24
- 25
- 26
- 27
- 28
- 29
- 30
- 31
- 32
- 33
- 34
- 35
- 36
- 37
- 38
- 39
- 40
- 41
- 42
- 43
- 44
- 45
- 46
- 47
- 48
- 49
- 50
- 51
- 52
- 53
- 54
- 55
- 56
- 57
- 58
- 59
- 60
- 61
- 62
- 63
- 64
- 65
- 66
- 67
- 68
- 69
- 70
- 71
- 72
- 73
- 74
- 75
- 76
- 77
- 78
- Current
- Review
- Answered
- Correct
- Incorrect
-
Question 1 of 78
1. Question
78. Note: This question is part of a scenario-based series. Each question presents a different solution that may or may not meet the stated requirement. Once answered, you cannot return to review this question.
You have a Power BI report that imports data from an Azure SQL Database.
The model includes:
A Date table
A Sales tableThe Sales table contains three date foreign key columns:
Due Date
Order Date
Delivery DateYou need to enable analysis of sales over time using all three date columns.
Proposed solution:
Rename the existing Date table to Due DateCreate two additional calculated date tables using DAX:
Order Date
Delivery DateCreate active relationships between the Sales table and each date table
Does this solution meet the goal?
-
Question 2 of 78
2. Question
79. You have a Power BI semantic model that includes data for:
Item
Price
CountryThe data is displayed in a report that already uses filters (for example, slicers by country or item).
You need to calculate the average item price for a selected country, and the calculation must respect all existing filters in the report.
Which type of Quick Measure should you use?
-
Question 3 of 78
3. Question
80. You have a Power BI semantic model that includes four queries:
Query1
Query2
Query3
Query4Query1 loads customer data into the model and is referenced by the other three queries.
You notice that data refresh is slow, and you need to improve refresh performance while minimizing costs.
What should you do?
-
Question 4 of 78
4. Question
81. You have a Power BI semantic model that connects to a streaming data source which updates very frequently.
You need to build a Power BI report that satisfies all of the following requirements:
Supports real-time analytics
Minimizes performance impact on the source system
Shows the most recent data instantly, without requiring a dataset refresh
Which connectivity mode should you use for the dataset?
-
Question 5 of 78
5. Question
82. You have a Power BI report named Summary1 and notice that it is slow to load or interact with.
To investigate, you run Performance Analyzer in Power BI Desktop to review performance metrics for the report.
Which two metrics in Performance Analyzer show the execution duration (time taken)?
NOTE: Each correct answer is worth one point.
-
Question 6 of 78
6. Question
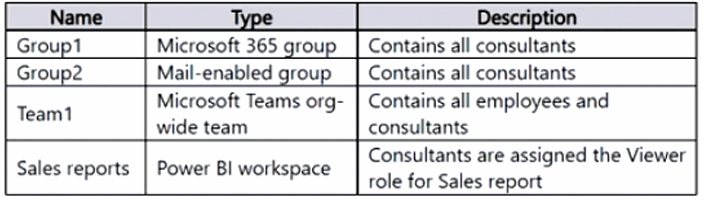
83. You have a Microsoft 365 subscription that includes several resources (as shown in an exhibit).
You create a new Power BI dashboard that uses row-level security (RLS) and define a new security role named Consultants.
You need to assign the Consultants role to an appropriate resource.
To which resource can you assign the Consultants role?
-
Question 7 of 78
7. Question
84. You have a Power BI data model with two tables:
Sales
DateThe Sales table is related to the Date table using a many-to-one relationship and contains the following columns:
Date
Product
SalesAmountYou need to create a DAX measure that calculates a rolling 31-day total of sales, meaning:
It returns the total SalesAmount for the selected datePlus the previous 30 days
Which DAX expression should you use?
-
Question 8 of 78
8. Question
85. You publish a Power BI semantic model to the Power BI service.
The model connects to the following data sources:Source1: A Microsoft Excel file stored in Microsoft OneDrive for Business
Source2: An Azure SQL Database hosted on a virtual network (VNet)
Source3: A public website
You need to determine which data source requires an on-premises data gateway.
Which option is correct?
-
Question 9 of 78
9. Question
86. You have a Power BI semantic model built with two queries.
A report that uses this model is experiencing performance issues.You plan to optimize performance by reducing the amount of data loaded into the model using Power Query.
Which two actions should you perform?
NOTE: Each correct answer is worth one point.
-
Question 10 of 78
10. Question
87. Note: This question is part of a scenario-based series. Each question proposes a different solution that may or may not meet the stated goal. Once answered, you cannot return to review it.
You have an on-premises data gateway.
You want to reduce the amount of data sent through the gateway for semantic models that use Import storage mode.Proposed solution:
Create aggregations to summarize results.
Does this solution meet the goal? -
Question 11 of 78
11. Question
88. Note: This question is part of a scenario-based series. Each question proposes a different solution that may or may not meet the stated goal. Once answered, you cannot return to review it.
You have an on-premises data gateway.
You need to reduce the amount of data sent through the gateway by semantic models running in Import storage mode.Proposed solution:
Increase Automatic page refresh intervals.
Does this solution meet the goal? -
Question 12 of 78
12. Question
89. Note: This question is part of a scenario-based series. Each question proposes a different solution that may or may not meet the stated goal. Once answered, you cannot return to review it.
You have an on-premises data gateway.
You need to reduce the amount of data sent through the gateway for semantic models that use Import storage mode.Proposed solution:
Configure incremental refresh.
Does this solution meet the goal? -
Question 13 of 78
13. Question
90. Note: This question is part of a scenario-based series. Each question proposes a different solution that may or may not meet the stated goal. Once answered, you cannot return to review it.
You have an on-premises data gateway.
You need to reduce the amount of data sent through the gateway for semantic models that use Import storage mode.Proposed solution:
Decrease the dashboard cache update frequency.
Does this solution meet the goal? -
Question 14 of 78
14. Question
91. You have a Power BI semantic model named Model1 that uses Import storage mode.
You need to reduce the size of Model1, and the solution must not increase report query response times.
What should you do? -
Question 15 of 78
15. Question
92. You have a Power BI semantic model named Model1 that uses Import storage mode.
You need to reduce the size of Model1.
Which two actions should you perform? -
Question 16 of 78
16. Question
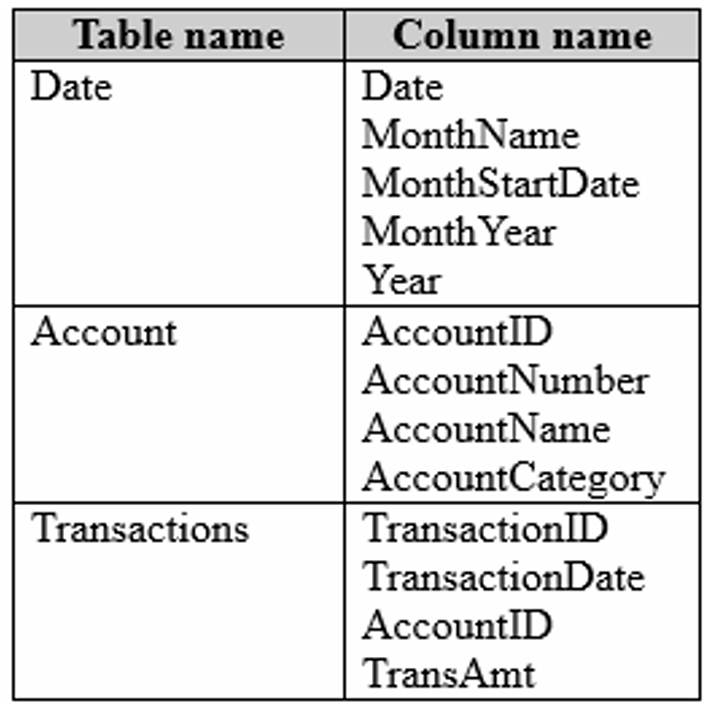
93. You have a Power BI semantic model with transaction data.
You need to design a solution that meets all of these requirements:
Shows monthly total transaction amounts for the current year and previous year
Uses a star schema modeling approach
Minimizes the size of the data modelWhich three actions should you perform?
-
Question 17 of 78
17. Question
94. You have a Power BI semantic model named Model1 with two tables:
DimDate (marked as the Date table)
FactSales
There is an active relationship between DimDate and FactSales.
The FactSales table contains sales data (as shown in the exhibit).
The model includes the following measure:Previous Year Sales =CALCULATE( [Sales Amount],PREVIOUSYEAR(‘Date'[Date]))
You create a report that uses Model1.
The report contains one page, and a page-level filter is set to:
May 9, 2024The Previous Year Sales measure is displayed in a card visual.
What value will appear in the card?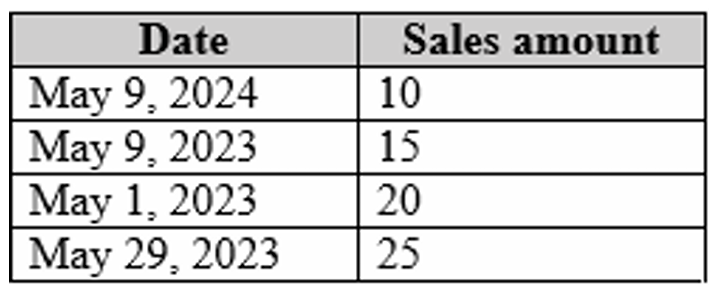
-
Question 18 of 78
18. Question
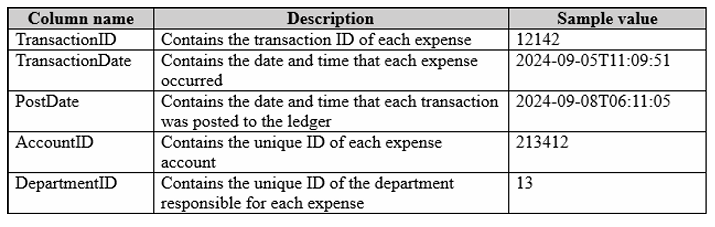
95. You have a Power BI query named Expenses that imports expense data.
The table includes a TransactionDate column that contains both date and time values.Users perform analysis using only the date portion of TransactionDate.
You need to reduce the model size while ensuring that analysis results remain unchanged.Which two actions should you take?
-
Question 19 of 78
19. Question
96. You have a Power BI semantic model with two tables:
DimCustomer (dimension table)
Primary key: CustomerID
FactOrderDetails (fact table)
Contains CustomerID
Multiple rows can share the same CustomerIDYou need to create a relationship from FactOrderDetails to DimCustomer.
The relationship must optimize query performance.What should you create?
-
Question 20 of 78
20. Question
97. You have a Power BI data model with a table named Expenses that includes the following columns:
Date
Amount
Category
Expense ID
Employee ID
Each expense is recorded by an employee, and each expense has a unique Expense ID.You need to create a DAX measure that calculates the total amount of expenses.
Which DAX expression should you use? -
Question 21 of 78
21. Question
98. You are working in Power Query Editor with a query that contains a column named Classes.
Each cell in the Classes column contains multiple values separated by a delimiter.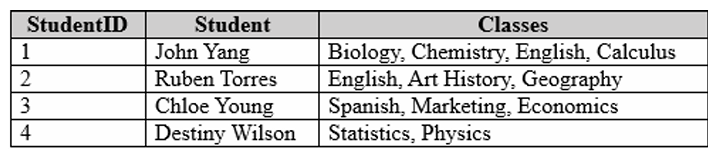
You need to transform the data so that:
Each class appears on its own row
The resulting table matches the structure shown in the exhibit
What should you do?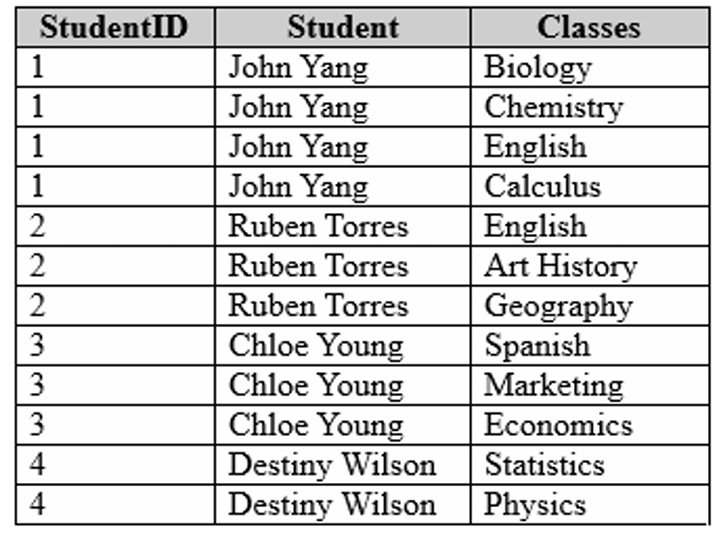
-
Question 22 of 78
22. Question
99. You have a Microsoft Fabric Eventhouse named Eventhouse1 that stores high-velocity, high-volume IoT data.
Eventhouse1 supports near-real-time (NRT) querying for reports.
You want to use Power BI Desktop to build a report that shows both historical data and live data.
The solution must minimize development effort.What should you do?
-
Question 23 of 78
23. Question
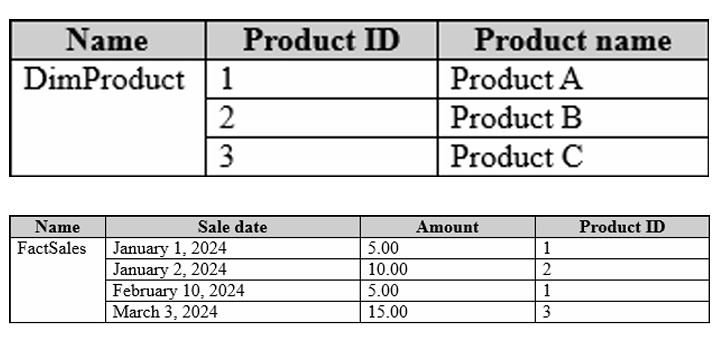
100. You have a Power BI semantic model with a fact table (FactSales) and a dimension table (DimProduct).
You need to create a relationship from FactSales to DimProduct.
The solution must ensure the fastest DAX query performance.Which cardinality should you use?
-
Question 24 of 78
24. Question
101. You have a Power BI semantic model that contains a table named Table1.
Table1 currently uses Import storage mode.You need to change the storage mode of Table1 to DirectQuery.
What should you do? -
Question 25 of 78
25. Question
102. You have a Power BI semantic model with tables and relationships as shown in the exhibit.
Based on the model design, what type of dimension does Dim Address represent?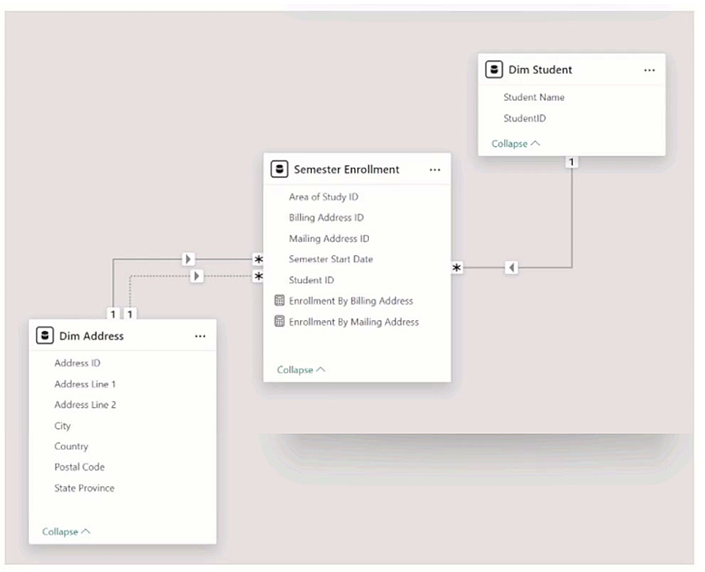
-
Question 26 of 78
26. Question
103. You have a Power BI report with two visuals:
A bar chart that shows customer count by customer segment
A column chart that shows sales by monthYou want the following behavior:
When a customer segment is selected in the bar chart
The column chart should show which portion of each month’s total sales belongs to that selected segmentHow should the visual interaction be configured for the column chart when the bar chart is selected?
-
Question 27 of 78
27. Question
104. A user creates a Power BI report named ReportA that uses a custom theme.
You then create a dashboard named DashboardA.You need to ensure that DashboardA uses the same custom theme as ReportA, while minimizing development effort.
Which two actions should you perform? -
Question 28 of 78
28. Question
105. You need to create a visualization that compares revenue and cost over time.
Which type of visualization should you use? -
Question 29 of 78
29. Question
106. You are building a Power BI report to help the sales team understand:
Overall sales performance
The drivers (factors) that influence sales success
The team wants a single visualization that clearly identifies which factors affect success.Which type of visualization should you use?
-
Question 30 of 78
30. Question
107. You use a Key influencers visual to analyze which factors affect the quantity of items sold per order.
Several fields (Customer Country, Product Category, Supplier info, Product info, Customer City, etc.) are placed in Explain by.Based on the results shown in the visual, what can you identify?
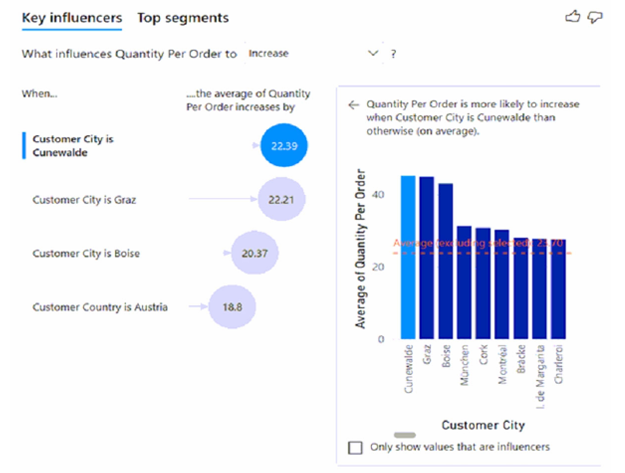
-
Question 31 of 78
31. Question
108. You have a Power BI report with four pages.
Each page contains slicers for the same four fields.
Users report that when they make a selection on one page, the selection does not carry over to the other pages.
You need a solution so users can select a value once and have it filter all pages.Which two recommendations will achieve this?
-
Question 32 of 78
32. Question
109. You have a Power BI report with a card visual.
You need to apply conditional formatting to the data label font color, with minimal design effort:
≥ 100 → Dark red
< 100 → Dark grayWhich type of conditional formatting should you use?
-
Question 33 of 78
33. Question
110. You are creating a dashboard in the Power BI service.
You already have a report page that contains three charts with interactive behavior (for example, cross-filtering and highlighting between charts).
You need to add these charts to a dashboard while preserving the interactivity between them.What should you do?
-
Question 34 of 78
34. Question
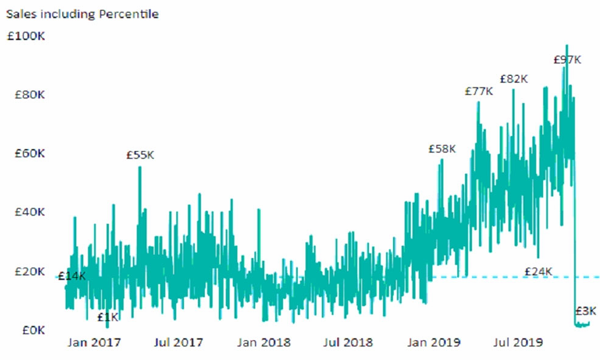
111. You want to create the chart shown in the exhibit, which includes a dashed horizontal line indicating the 40th percentile of daily sales for the displayed period.
How should you create the dashed horizontal line?
-
Question 35 of 78
35. Question
112. You are designing a Power BI report that will be viewed on mobile devices.
The report must display data dynamically based on each user’s geographic location.Which two actions are required to ensure the report correctly recognizes and uses location-based data?
Each correct answer represents part of the solution. -
Question 36 of 78
36. Question
113. A Power BI report includes a donut chart and a clustered column chart.
The interactions between the visuals are currently set to the default behavior.
You want the donut chart to update (redraw) and display data only for the selected column when a user clicks a column in the clustered column chart.What action should you take?
-
Question 37 of 78
37. Question
114. You are building a report in Power BI Desktop and need to add a visual that:
Automatically generates insights such as trends and key observations
Dynamically updates based on selections made in other visuals on the report pageWhich type of visual should you use?
-
Question 38 of 78
38. Question
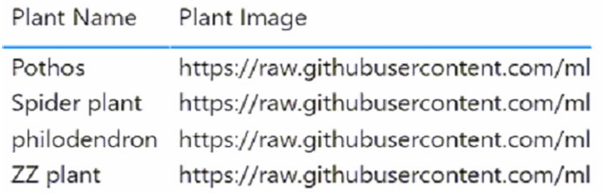
115. In Power BI Desktop, you have a dataset containing a table with a column named Plant Image that stores image URLs.
You added a table visual to a report page (as shown in the exhibit).
Right now, the table shows the URL text.
You want the table visual to display the actual image (render the picture) instead of showing the URL.What should you do?
-
Question 39 of 78
39. Question
116. Note: This question is part of a multi-question scenario. Each question proposes a different solution that may or may not satisfy the stated requirement.
You have a clustered bar chart with:
A measure called Salary used as the value
A field called Employee used as the axis
The Salary values represent actual monetary amounts in US dollars.
You want to add a reference line that indicates which employees earn more than the median salary.Proposed solution:
Add a constant line and set its value to 0.5.Does this solution meet the requirement?
-
Question 40 of 78
40. Question
117. Note: This question is part of a scenario-based series. Each question suggests a different approach that may or may not satisfy the requirement. Once answered, you can’t return to it.
You have a clustered bar chart where:
Salary (a measure) is used as the Values
Employee is used as the Axis
Salary values are numeric amounts in US dollars
You need to add a reference line that helps identify which employees earn above the median salary.Proposed solution:
Add an Average line using the Salary measure.Does this solution achieve the goal?
-
Question 41 of 78
41. Question
118. Note: This question belongs to a series where each question proposes a different solution that may or may not meet the requirement. Once you answer, you cannot return to this question.
You have a clustered bar chart with:
A measure named Salary used as the Values
A field named Employee used as the Axis
Salary values stored as numeric US dollar amounts
You need to add a reference line that indicates which employees earn above the median salary.Proposed solution:
Add a Percentile line using the Salary measure and set the percentile value to 50%.Does this solution satisfy the requirement?
-
Question 42 of 78
42. Question
119. You have a Power BI report published to powerbi.com that shows department expenses for department managers.
The report currently includes a line chart displaying expenses by month.You want users to be able to switch between a line chart and a column chart when viewing the report.
The solution must require minimal development and ongoing maintenance.What should you do?
-
Question 43 of 78
43. Question
120. You have two Microsoft Power BI reports, ReportA and ReportB, each using a different color palette.
You are building a Power BI dashboard that will include two visuals from each report.
You want the dashboard to use a consistent dark theme, while retaining the original colors of the visuals from both reports.Which two actions should you take?
Each correct answer represents part of the solution. -
Question 44 of 78
44. Question
121. You have a line chart that displays the number of employees in a department over time.
You want to view the total salary cost for those employees when hovering over a data point on the chart.What should you do?
-
Question 45 of 78
45. Question
122. You have a visual displayed as shown in the Original exhibit.
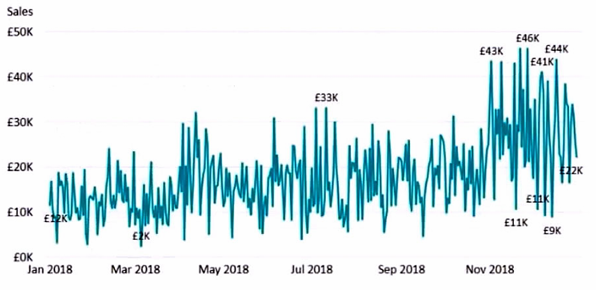
You need to modify the visual so that it matches the Modified exhibit.
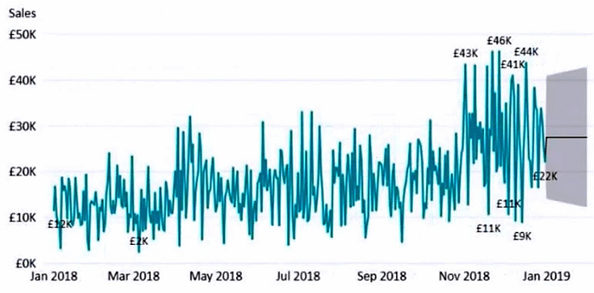
What should you add to the visual to achieve this result?
-
Question 46 of 78
46. Question
123. You need to build a visual that allows users to interactively and ad-hoc explore data, as illustrated in the exhibit.
Which type of visual should you use?
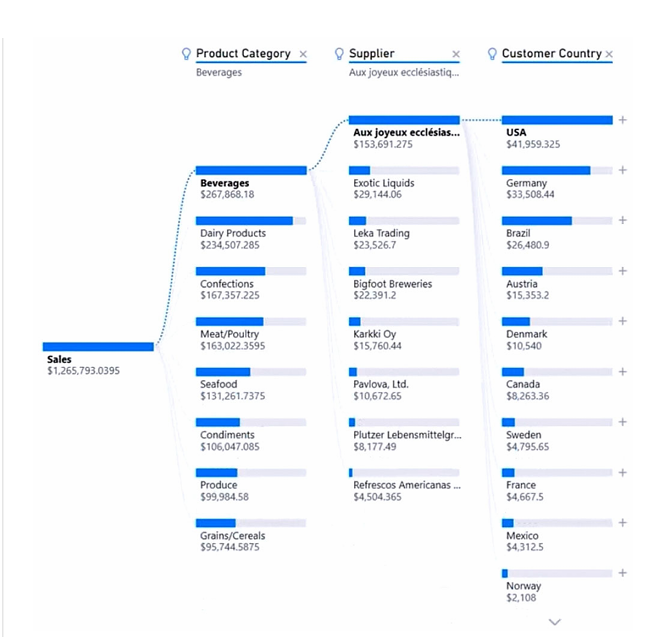
-
Question 47 of 78
47. Question
124. Your organization operates in 10 different states.
Management has recently classified each state into one of three regions: East, West, or North.
Your existing data model contains employee information by state only and does not include a region field.
A report currently displays employees grouped by state.
You need to quickly view the employees grouped by region.What should you do?
-
Question 48 of 78
48. Question
125. You manage a set of Power BI reports for your company’s HR department.
You need to create a visual that:
Displays historical employee counts, and
Forecasts trends for the next six months.Which type of visualization should you use?
-
Question 49 of 78
49. Question
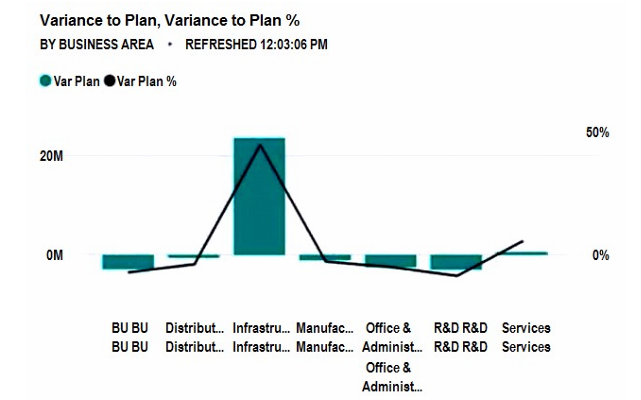
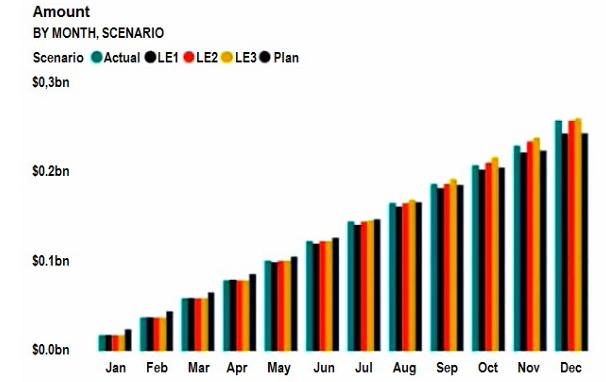
126. You have a Microsoft Power BI dashboard created from a report that uses an imported dataset sourced from Microsoft SQL Server.
The dashboard activity timeline is shown in the exhibit.What event took place at 12:03:06 PM?
-
Question 50 of 78
50. Question
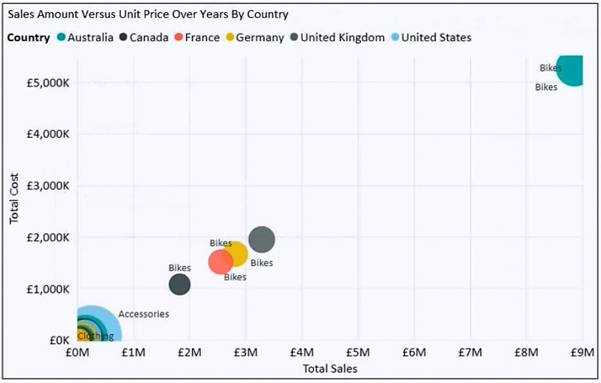
127. You have a visual displayed as shown in the exhibit.
You want to visualize the relationship between Total Cost and Total Sales over time.What should you do?
-
Question 51 of 78
51. Question
128. You are creating a Power BI report to analyze customer segments.
You want to dynamically break down and explore customer segments based on Bounce Rate, across multiple dimensions such as traffic source, geography, and demographics.
The solution should require minimal analysis effort from the user.Which type of visual should you use?
-
Question 52 of 78
52. Question
129. You have a table that contains sales data with approximately 1,000 rows.
You want to identify outliers in the data.Which type of visualization should you use?
-
Question 53 of 78
53. Question
130. You have a Power BI report with three pages.
One of the pages includes a KPI visual.
You need to apply a filter that affects all visuals across the report, except for the KPI visual.Which two actions should you take to meet this requirement?
-
Question 54 of 78
54. Question
131. You are building a Power BI report to analyze consumer purchasing behavior using a table named Transactions.
The table includes a numeric field called Spend.
You need a visual that can identify which factors or fields most strongly influence Spend.Which type of visual should you use?
-
Question 55 of 78
55. Question
132. You have a Power BI dashboard that contains tiles pinned from a single report, as shown in the Original Dashboard exhibit.
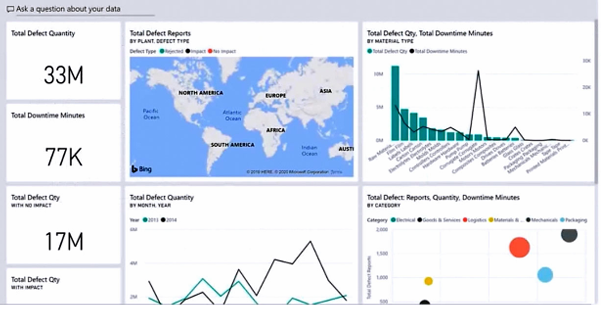
You need to change the dashboard so that it appears like the Modified Dashboard exhibit.
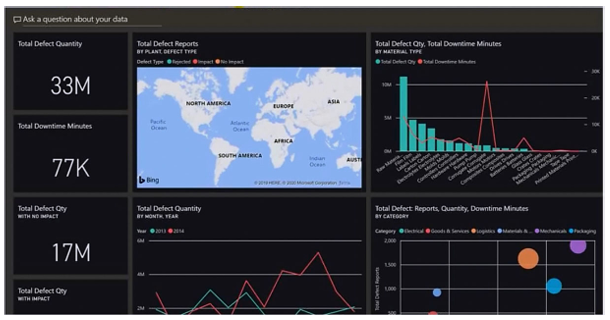
What should you do?
-
Question 56 of 78
56. Question
133. You have a Power BI report with a visual that displays gross sales by date.
Anomaly detection is enabled on the visual, but no anomalies are currently detected.
You want to increase the chance that anomalies are identified in the report.What should you do?
-
Question 57 of 78
57. Question
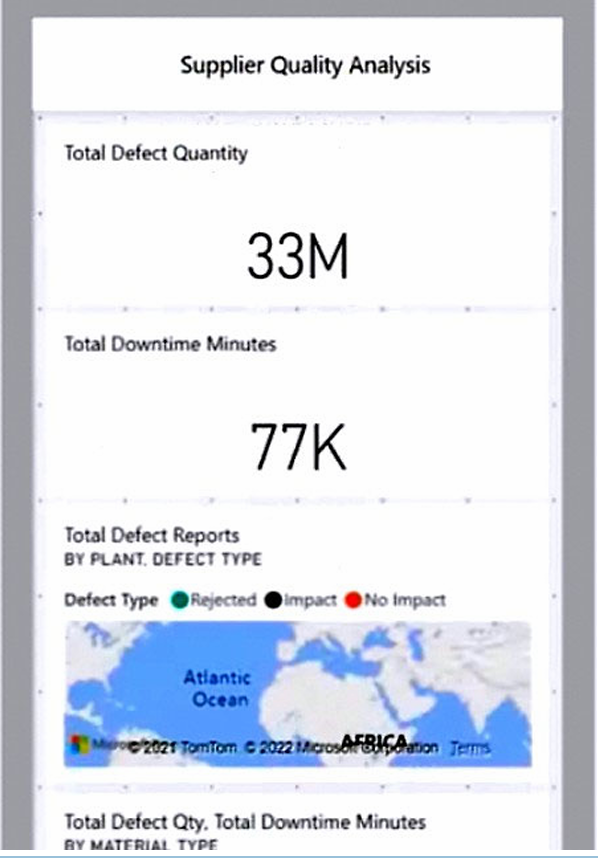
134. You manage a Power BI workspace that includes a supplier quality dashboard. The dashboard has:
10 card visuals
2 map visuals
5 bar chart visuals
The mobile layout of the dashboard is shown in the exhibit.You need to adjust the mobile layout to meet these requirements:
Show only single-value visuals
Reduce scrolling as much as possibleWhat should you do?
-
Question 58 of 78
58. Question
135. You are working with a Power BI report that uses a table named Data1 containing 10 million rows.
The table is used in these visuals:
A card showing the total number of records
A bar chart showing total transaction amount by territory
A scatter plot showing transaction amount vs. profit, with points colored by territoryYou want to improve the scatter plot so users can more easily spot meaningful patterns, without changing the accuracy of the other visuals.
What should you do?
-
Question 59 of 78
59. Question
136. You have a Power BI workspace named Inventory that includes a dataset, a report, and a dashboard.
You need to add a new dashboard tile that displays inventory by location.
This information is not currently shown in the report, and you want to minimize any changes to the report.Which two actions should you take to meet this requirement?
-
Question 60 of 78
60. Question
137. You have a Power BI report with three pages: Page1, Page2, and Page3.
Each page contains the same slicers.
You need to make sure that any filters applied on Page1 also apply to Page3, but do not affect Page2.What should you do?
-
Question 61 of 78
61. Question
138. You have a Power BI report with five pages:
Pages 1–4 are visible
Page 5 is hidden
You want users to be able to quickly navigate from Page 1 to all other visible pages.
The solution must require minimal development and ongoing maintenance, especially as new pages are added to the report.What should you do first?
-
Question 62 of 78
62. Question
139. You have created a Power BI report that displays IoT temperature data streaming from a refrigerator.
The report has been published to the Power BI service.
You need to receive a notification when the temperature exceeds 4°C.What should you do?
-
Question 63 of 78
63. Question
140. You have a Power BI dashboard displayed as shown in the original exhibit.
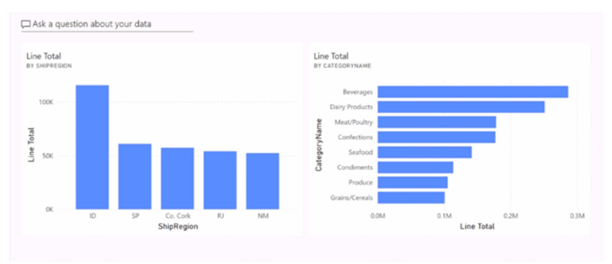
You need to modify the dashboard so that it appears as shown in the updated exhibit.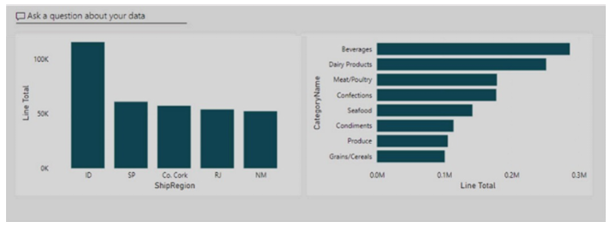
What should you do?
-
Question 64 of 78
64. Question
141. You need to create a Power BI theme that can be reused across multiple reports.
The theme must include corporate branding, such as:
Font sizes
Color schemes
Bar chart formattingWhat should you do?
-
Question 65 of 78
65. Question
142. You have a Power BI report with a single page that includes:
Two line charts
One bar chartYou want users to be able to perform the following actions on all three visuals:
Change the measures used in the visuals
Switch the visualization type
Add or modify a legend
The solution must require minimal development effort.What should you do?
-
Question 66 of 78
66. Question
143. Note: This question is part of a scenario-based series. Each question proposes a different solution that may or may not satisfy the requirement. Once answered, you cannot return to this question.
You have a clustered bar chart where:
Salary (a measure) is used as the Values
Employee is used as the Axis
Salary values are numeric amounts in US dollars
You need to add a reference line that indicates which employees earn above the median salary.Proposed solution:
Add a Median line using the Salary measure.Does this solution meet the requirement?
-
Question 67 of 78
67. Question
144. You have a Power BI report with four pages, and each page includes a slicer for a field named Country.
You need to ensure that:
A country selected on Page 1 is also applied to Page 2 and Page 3, and
Page 4 is not affected by selections made on the other pages.What should you do?
-
Question 68 of 78
68. Question
145. You want to use Power BI to generate sales invoices for customers.
The solution must meet these requirements:
Invoices must be exported as PDF files
The exported PDFs must clearly display all rows and columns without truncationWhat should you create?
-
Question 69 of 78
69. Question
146. You have a Power BI report page that includes:
A shape named Shape1
A card visual named Sales Summary
A clustered bar chart named Sales by Region
You want to make sure that the Sales Summary card appears on top of (in front of) Shape1.What should you modify?
-
Question 70 of 78
70. Question
147. You have a Power BI report named Report1 and a dashboard named Dashboard1.
Report1 includes a visual called Sales by month, which is initially a line chart and has been pinned to Dashboard1.
Later, in Report1, you change the Sales by month visual from a line chart to a bar chart.
You want the bar chart version to appear on Dashboard1.What should you do?
-
Question 71 of 78
71. Question
148. In Power BI Desktop, you are building a report that will include three pages.
You need to create a custom tooltip page and ensure it is properly configured for use as a tooltip.Which three actions should you perform to prepare the tooltip page?
-
Question 72 of 78
72. Question
149. You have a Microsoft Power BI report named ReportA.
Your Power BI tenant allows users to export data.
You need to make sure that report consumers cannot export data from any visuals in ReportA.Which two actions should you perform?
Each correct answer represents a complete solution. -
Question 73 of 78
73. Question
150. You have a Power BI report that will be displayed on a vertical screen.
You want to maximize the usable screen space so the report fits the vertical layout as effectively as possible.What should you do?
-
Question 74 of 78
74. Question
151. You need to create a visual that compares profit across 10 different product categories for a selected quarter.
Which type of visual is best suited to achieve this goal?
-
Question 75 of 78
75. Question
152. You have a Power BI dataset named Finance that is stored in a Power BI workspace.
The finance team is not currently assigned to any workspace roles.
You need to allow the finance team to analyze the Finance dataset using Microsoft Excel.What should you do?
-
Question 76 of 78
76. Question
153. You have a Power BI report with a visual that displays a measure.
You must ensure that:
All values show two decimal places
Negative values appear in red and are enclosed in parenthesesWhich two actions should you take to meet these requirements?
-
Question 77 of 78
77. Question
154. You have a Microsoft Power BI data model with two tables: Population and Date.
Population includes:
PopulationAmount
DateKey (a date representing the first day of a year)
DateKey is related to the Date table in a many-to-one relationship.You define the following measures:
Total Population = SUM(‘Population'[PopulationAmount])
2023 Population = CALCULATE([Total Population], ‘Date'[Year] = 2023)
You then create a table visual that shows Date[Year] and [2023 Population].What will the table display?
-
Question 78 of 78
78. Question
155. You have a Power BI dataset that contains quarterly sales performance data.
You need to provide managers with a way to review the data that:
Is optimized for printing, and
Can be rendered in Microsoft Excel, Word, PowerPoint, and PDF formats.What should you create?