
Assessment Summary
0 of 78 Questions completed
Questions:
Information

You have already completed the assessment before. Hence you can not start it again.
Assessment is loading…
You must sign in or sign up to start the assessment.
You must first complete the following:
Results
YOUR RESULTS
0 / 78 Questions Correct!
Time:
Time has elapsed
You have reached 0 of 0 point(s), (0)
Earned Point(s): 0 of 0, (0)
0 Essay(s) Pending (Possible Point(s): 0)
Categories
- Not categorized 0%


- 1
- 2
- 3
- 4
- 5
- 6
- 7
- 8
- 9
- 10
- 11
- 12
- 13
- 14
- 15
- 16
- 17
- 18
- 19
- 20
- 21
- 22
- 23
- 24
- 25
- 26
- 27
- 28
- 29
- 30
- 31
- 32
- 33
- 34
- 35
- 36
- 37
- 38
- 39
- 40
- 41
- 42
- 43
- 44
- 45
- 46
- 47
- 48
- 49
- 50
- 51
- 52
- 53
- 54
- 55
- 56
- 57
- 58
- 59
- 60
- 61
- 62
- 63
- 64
- 65
- 66
- 67
- 68
- 69
- 70
- 71
- 72
- 73
- 74
- 75
- 76
- 77
- 78
- Current
- Review
- Answered
- Correct
- Incorrect
-
Question 1 of 78
1. Question
156. You have a Power BI report that includes several visuals, as shown in the table.
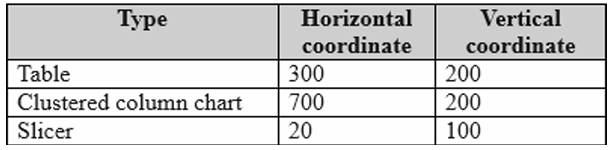
You need to change where each visual is placed on the report canvas.What setting should you modify for each visual?
-
Question 2 of 78
2. Question
157. You have a Microsoft Power BI report that includes a line chart showing sales data across multiple regions.
You want to add an element that allows users to filter the sales data to a selected region.Which two elements can be used to meet this requirement?
Each correct answer represents a complete solution. -
Question 3 of 78
3. Question
158. You have a CSV file structured as shown in the table.
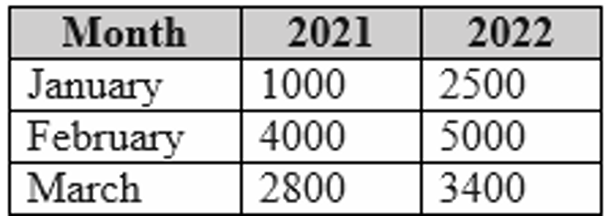
You open the file in Power Query Editor to preview the data.You need to transform the data so that:
The first column contains the month
The second column contains the year
The third column contains the order amount for the corresponding month and yearWhich transformation should you apply first?
-
Question 4 of 78
4. Question
159. You are designing a single-page Power BI report.
Some users will navigate the report using a keyboard, while others will use a screen reader.
You need to make sure that the content on the report page is read and navigated in a logical, accessible order.What should you configure on the report page?
-
Question 5 of 78
5. Question
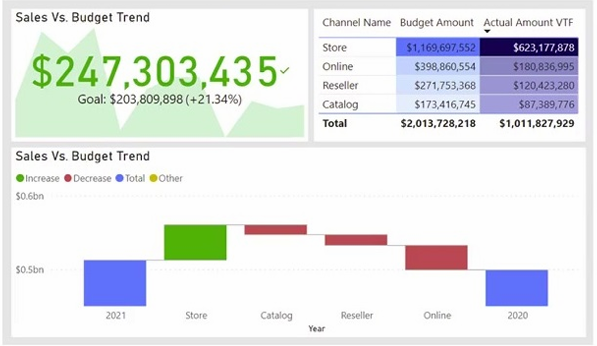
160. You are configuring a Microsoft Power BI report to improve accessibility.
The report contains three visuals, and you need to adjust their default colors so the report is more usable for people with color vision deficiency.Which two settings should you configure in the Customize theme window to achieve this?
-
Question 6 of 78
6. Question
161. You want to use Power BI to create a visual that allows users to compare sales performance across five sales regions for the current month.
Which type of visual should you use?
-
Question 7 of 78
7. Question
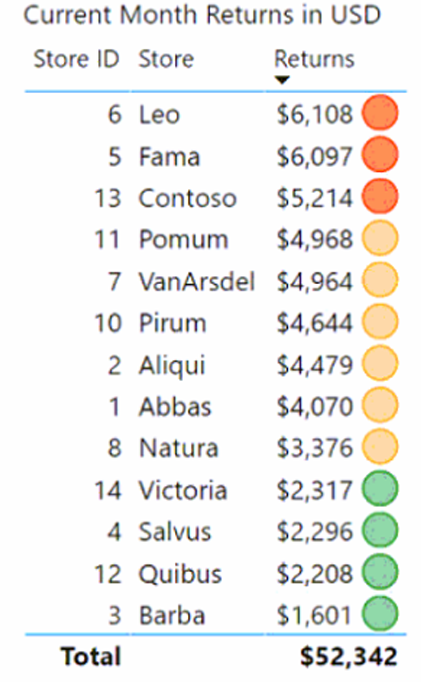
162. You have a Power BI report that includes a table with conditional formatting icons.
The icons indicate whether each store is above, near, or below the monthly return quota.
You need to make sure the table is accessible to users with color vision deficiency.What should you do?
-
Question 8 of 78
8. Question
163. You have a Power BI report that contains a single visual.
You want users to be able to change the visual type for their own view without impacting what other users see.What should you do?
-
Question 9 of 78
9. Question
164. You have a Power BI report with a card visual that shows year-to-date revenue.
You need to make sure that screen reader users can hear the value as soon as they interact with the card, and that the value automatically updates whenever the dataset refreshes.What should you do?
-
Question 10 of 78
10. Question
165. You have a Power BI report that includes a table visual with a column of whole numbers ranging from 1 to 20.
You need to apply conditional formatting that meets the following requirements:
Allow users to visually compare values without reading the numeric text
Display a distinct visual representation for each value
Hide the numeric value in the column
Require minimal development effortWhich type of conditional formatting should you use?
-
Question 11 of 78
11. Question
166. You have a Power BI report that includes a table visual, as shown in the exhibit.
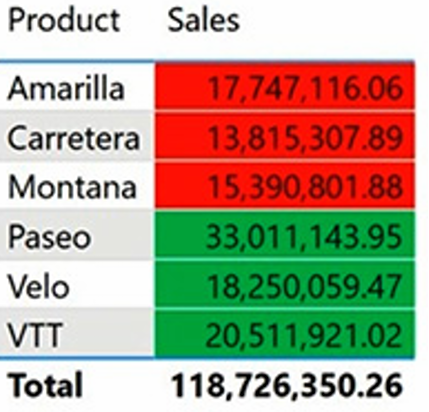
You want to make the visual more accessible for users with color vision deficiency.What should you do?
-
Question 12 of 78
12. Question
167. You have a Power BI app that includes a report named Report1.
You add a new page to Report1 and want to make sure that users can access the new page.
The solution should require minimal administrative effort.What should you do?
-
Question 13 of 78
13. Question
168. You have a Power BI semantic model with a table named Table1 that includes the following columns:
WebsiteName
URLYou need to create a report (Report1) that contains a table visual which:
Displays the website name, and
Allows users to open the corresponding website by selecting the website name.What should you use to meet these requirements?
-
Question 14 of 78
14. Question
169. You have a Power BI semantic model named Model1 with two fields:
Sales
Quarter
The model includes a DAX measure that calculates the total of Sales.
You need to create a report that displays a visual matching the exhibit shown.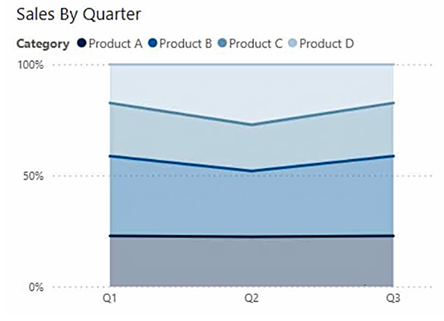
The solution must not require creating any additional DAX measures.Which type of visual should you use?
-
Question 15 of 78
15. Question
170. You have a Power BI report with a bar chart that shows sales by country.
You need to make sure that a summary of the chart’s data can be read by screen reader users.What should you configure on the bar chart?
-
Question 16 of 78
16. Question
171. You want to create a line chart that compares sales data for the last six months across two departments.
You need to improve the accessibility of the visual.What should you do?
-
Question 17 of 78
17. Question
172. You have a Power BI report with a single report page that uses the default theme.
You need to adjust the page so that its appearance matches the formatting shown in the exhibit.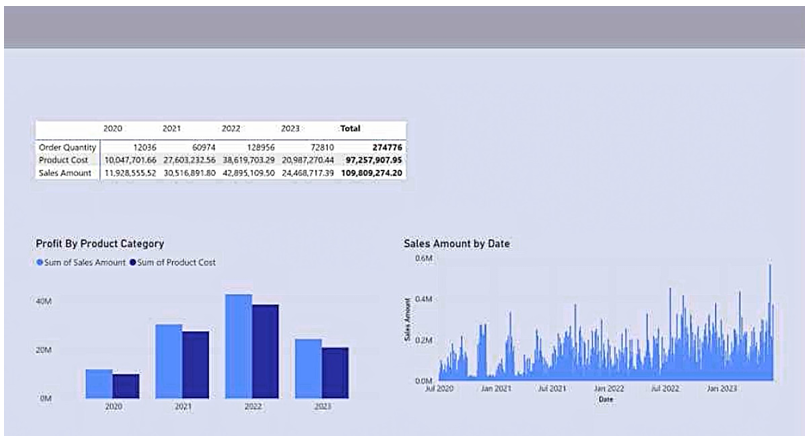
What should you modify on the report page?
-
Question 18 of 78
18. Question
173. You are creating a visual in a Microsoft Power BI report.
The underlying semantic model includes four years of sales data for three products.
You need to show total sales by quarter, broken down by product, and the visual must clearly present trends over time for both:
Overall (total) sales, and
Individual product sales.Which type of visual should you use?
-
Question 19 of 78
19. Question
174. You have a Power BI report with a clustered bar chart where:
Sales is on the X-axis
Year is on the Y-axis
The chart shows data from 2020 to 2024
You need to create a visual calculation that displays a cumulative total of sales, defined as the current year’s sales plus all sales from the previous years.Which DAX expression should you use?
-
Question 20 of 78
20. Question
175. You are building a Power BI report that includes multiple visuals.
You need to make sure the report is accessible to users who rely on screen readers.Which two configurations should you apply?
-
Question 21 of 78
21. Question
176. You have a Power BI report with a stacked bar chart.
You need to add a new field to the legend. This field must combine values from multiple columns into a single label.What should you create?
-
Question 22 of 78
22. Question
177. You manage a Power BI tenant with reports that use financial datasets and are exported as PDF files.
You need to ensure that these exported reports are encrypted.What should you implement?
-
Question 23 of 78
23. Question
178. You have a Microsoft Excel file stored on a file server.
You import a table from the Excel file into Power BI, create a report, and then publish the report.
You need to make sure the data refreshes every four hours.What should you do first?
-
Question 24 of 78
24. Question
179. You have a dataset in Microsoft Power BI that is rarely used and is scheduled to refresh every hour.
You receive a notification indicating that scheduled refresh was disabled due to inactivity.Which two actions will cause the scheduled refresh to resume?
Each correct answer represents a complete solution. -
Question 25 of 78
25. Question
180. You have a Power BI workspace that includes a dataset, a report, and a dashboard.
Access is configured as follows:
External users can view the dashboard
Managers can view the dashboard and a manager-specific report
Employees can view the dashboard and a report restricted by row-level security (RLS)
You want all users (including external users) to be able to flag issues they find on the dashboard by tagging workspace administrators, and you want other users to see the reported issues.What should you use?
-
Question 26 of 78
26. Question
181. You have a PBIX file that imports multiple tables from an Azure SQL Database.
The data is being migrated to a different Azure SQL Database.
You need to update the data connections in the PBIX file, and the solution should require minimal administrative effort.What should you do?
-
Question 27 of 78
27. Question
182. You have a Power BI workspace that contains multiple reports.
You want to allow a user to create a dashboard using visuals from those reports.What should you do?
-
Question 28 of 78
28. Question
183. You have a Power BI report named report1 that uses a shared dataset.
You want to reduce the risk of data exfiltration from report1, and the solution must not impact other reports that use the same dataset.What should you do?
-
Question 29 of 78
29. Question
184. In Power BI Desktop, you’re building visuals in a report that uses an Import model.
You must let users export summarized data from visuals, but block exporting underlying data.What should you do?
-
Question 30 of 78
30. Question
185. You have a Power BI report that enforces row-level security (RLS).
You want an Azure network security team to take over maintaining who belongs to RLS roles.
Requirement: The Azure network security team must not gain permission to manage reports, datasets, or dashboards in Power BI.What should you do?
-
Question 31 of 78
31. Question
186. Your organization has four sales regions, each with several sales managers.
You’ve implemented row-level security (RLS) in a Power BI data model, where each region is mapped to a mail-enabled security group.Current behavior:
Sales managers can see only sales data for their own region
They are blocked from viewing other regionsScenario:
A sales manager is reassigned to a different region.
You need to make sure the sales manager now sees sales data for the new region only.What should you do?
-
Question 32 of 78
32. Question
187. Your organization has over 100 published Power BI datasets.
Out of these, 10 datasets have been validated to meet corporate quality standards.Requirement:
When users search for existing datasets, the 10 validated datasets must appear at the top of the results.What should you do?
-
Question 33 of 78
33. Question
188. You build a Power BI dashboard in the Power BI service that includes a card visual displaying year-to-date total sales.
Users are granted access to the workspace with the Viewer role.
One user wants to automatically receive a daily notification showing the value displayed in the card visual.What should you do?
-
Question 34 of 78
34. Question
189. You have a Power BI workspace called Workspace1. It contains:
a dataset named DS1
a report named RPT1A user needs to:
create a new report using the data in DS1, and
publish that report to a different workspace.You must give the user the minimum access required (least privilege).
What should you do? -
Question 35 of 78
35. Question
190. You have a Power BI workspace that contains five reports and two dashboards.
Requirement:
Give everyone in the organization read-only access to one dashboard and three specific reports.Proposed solution:
You publish a Power BI app and make it available to the entire organization.Does this solution meet the requirement?
-
Question 36 of 78
36. Question
191. You have a Power BI workspace that contains five reports and two dashboards.
Requirement:
Provide read-only access to all users in the organization for one dashboard and three specific reports.Proposed solution:
You enable Included in app for all assets in the workspace.Does this solution satisfy the requirement?
-
Question 37 of 78
37. Question
192. You manage a Power BI workspace that contains five reports and two dashboards.
Requirement:
Allow all users in the organization to have read-only access to one dashboard and three selected reports.Proposed solution:
You assign all organizational users the Viewer role for the entire workspace.Does this solution meet the requirement?
-
Question 38 of 78
38. Question
193. You publish a new dataset and report from Power BI Desktop to a Power BI workspace.
The dataset includes a row-level security (RLS) role named HR.Requirement:
Make sure HR team members have the HR RLS role enforced when they view reports that use this dataset.What should you do?
-
Question 39 of 78
39. Question
194. You have a Power BI dashboard used to monitor manufacturing quality.
The dashboard includes:
A line chart showing the daily count of defective products
A KPI visual displaying the current daily defect percentageRequirement:
You must receive a notification whenever the daily defect percentage goes above 3%.What should you create?
-
Question 40 of 78
40. Question
195. You create a report in Microsoft Power BI Desktop that connects to a SQL Server Analysis Services (SSAS) cube hosted on your company’s on-premises network.
You plan to publish the report to the Power BI service.Requirement:
Ensure that users viewing the report in the Power BI service always see the latest data from the SSAS cube.What should you implement?
-
Question 41 of 78
41. Question
196. You have five sales regions, each assigned to one salesperson.
An imported dataset uses dynamic row-level security (RLS) with a role named Sales, which filters sales transactions by salesperson so that each user can only see data for their own region.
You publish the dataset to powerbi.com, configure the RLS role membership, and share the dataset and related reports with the sales team.Scenario:
One salesperson says she believes she should be able to see more data than is currently visible.
Requirement:
You need to verify exactly what data this salesperson can see.What should you do?
-
Question 42 of 78
42. Question
197. You manage multiple Power BI dashboards.
Requirement:
When users browse dashboards in powerbi.com, they must be able to identify which dashboards contain Personally Identifiable Information (PII).Constraints:
Minimal configuration effort
No changes to dashboard layout or designWhat should you use?
-
Question 43 of 78
43. Question
198. You manage a Power BI workspace that contains five reports and two dashboards.
Requirement:
Give all users in the organization read-only access to one dashboard and three specific reports.Proposed solution:
You create an Azure Active Directory (Azure AD) group that includes all users, and you share the selected reports and the dashboard with that group.Does this solution satisfy the requirement?
-
Question 44 of 78
44. Question
199. You publish a dataset to the Power BI service. The dataset connects to an on-premises Microsoft SQL Server database.
When you try to set up a scheduled refresh, you can’t select the correct on-premises data gateway.You confirm the following with the gateway administrator:
You have the required permissions to use the gateway
The SQL Server data source has already been created on the gateway
The gateway status is RunningWhat is the most likely reason the gateway still can’t be selected?
-
Question 45 of 78
45. Question
200. You have a Power BI dataset and a report that is connected to that dataset.
Requirement:
Allow users to analyze the data in Microsoft Excel, but only by connecting directly to the dataset (not by exporting data from the report).
You have already granted users the Build permission on the dataset.What should you do next?
-
Question 46 of 78
46. Question
201. You have a Power BI workspace called BI Data that contains a dataset named BI Finance.
You have Build permission on the BI Finance dataset, but you do not have access to the BI Data workspace itself.
Requirement:
Connect to BI Finance and create a report.Which two actions can you perform to achieve this?
(Each correct answer represents a complete solution.) -
Question 47 of 78
47. Question
202. You create a report in Microsoft Power BI Desktop that connects to a SQL Server Analysis Services (SSAS) tabular model hosted on your company’s on-premises network.
You plan to publish the report to the Power BI service.Requirement:
Ensure that users who view the report in the Power BI service always see the most up-to-date data from the tabular model.What should you implement?
-
Question 48 of 78
48. Question
203. You have a Power BI semantic model named Model1 that contains sales data.
Requirement:
Ensure that Model1 refreshes on the first day of every month so it includes sales data from the previous month.What should you configure?
-
Question 49 of 78
49. Question
204. You manage a Power BI workspace named Workspace1 and have a group called Group1.
Requirement:
Make sure members of Group1 receive notifications when there are issues or problems in Workspace1.Constraint:
The solution must follow the principle of least privilege.What should you do?
-
Question 50 of 78
50. Question
205. You create a Power BI workspace called Workspace1 and publish a semantic model and a report to it.
You must configure access for a group named Sales with the following requirements:
Grant the group access to Workspace1
Allow the group to invite other users to the workspace
Apply the principle of least privilegeWhich workspace role should you assign to Sales?
-
Question 51 of 78
51. Question
206. You are building a new semantic model in Microsoft Power BI Desktop.
When connecting to a previously used data source, you receive an error stating that the password has expired.
Requirement:
Update the credentials for the data source.What should you do?
-
Question 52 of 78
52. Question
207. You open a PBIX file in Power BI Desktop that connects to a Microsoft Excel data source.
When you try to refresh the data, you receive the following error:
Expression.Error: The column ‘Cost’ of the table wasn’t found.What is a possible cause of this error?
-
Question 53 of 78
53. Question
208. You manage a Power BI workspace named WS1 that contains:
A semantic model called SM1
Three reports (RPT1, RPT2, RPT3) that all use SM1
A dashboard (DB1) built from RPT1 and RPT2You need to give access to a group named Group1 while meeting all of the following requirements:
Group1 can view RPT1, RPT2, and DB1
Group1 cannot view RPT3
Group1 cannot create new reports or dashboards using SM1
Group1 cannot share reports or dashboards with others
Administrative effort must be minimizedWhat should you do?
-
Question 54 of 78
54. Question
209. You have a Power BI report named Report1 that you want to share with multiple users.
To simplify access management, you decide to add the users to a group and share the report with that group instead of individual users.Which two types of groups can you use for this purpose?
(Each correct answer represents a complete solution.) -
Question 55 of 78
55. Question
210. You are creating a Power BI report that connects to multiple data sources.
One of these data sources contains tax records, which are highly sensitive.
Requirement:
Ensure that other queries cannot access or combine data from the tax records source.What Privacy Level should you assign to the tax data source?
-
Question 56 of 78
56. Question
211. You have a Power BI semantic model named Model1.
Requirement:
Allow users to confirm that the data in Model1 complies with corporate quality and governance standards.What should you do?
-
Question 57 of 78
57. Question
212. You try to open a PBIX file in Microsoft Power BI Desktop.
While loading data in Power Query Editor, you receive the following error message:
DataSource.Error: Could not find file D:\Data.txtWhat should you do to fix the issue?
-
Question 58 of 78
58. Question
213. You have a Microsoft Fabric workspace named Workspace1 that contains two Power BI reports: Report1 and Report2.
You publish a workspace app that includes both reports.You must configure the app so that:
Report1 is visible to all users in the organization
Report2 is visible only to a security group named Group1What should you do next?
-
Question 59 of 78
59. Question
214. You have a PBIX file that contains sensitive data.
You must secure the file to meet these requirements:
If the PBIX file is shared via email, only internal users can open it.After the file is published to the Power BI service, only internal users can open:
the semantic model, and
any report downloaded from the service.What should you do?
-
Question 60 of 78
60. Question
215. You need to create a relationship required for an executive-facing visual in a Power BI report.
Before you can create this relationship, a prerequisite change must be made to the data model.What should you do first?
-
Question 61 of 78
61. Question
216. You need to connect to tables in a Microsoft SQL Server database and retrieve data for use in Power BI.
Which option should you use to configure the connection?
-
Question 62 of 78
62. Question
217. You need to create a relationship between a product list table and a revenue results table in a Power BI data model.
Requirement:
The relationship configuration must optimize performance and minimize the time required to render visuals.What relationship cardinality should you choose?
-
Question 63 of 78
63. Question
218. You are creating balance sheet reports in Power BI.
You need a DAX measure that correctly returns the ending balance for each reporting period.Which DAX expression should you use?
-
Question 64 of 78
64. Question
219. You need to create table relationships in a Power BI data model to satisfy the reporting requirements of the customer service department.
What should you create?
-
Question 65 of 78
65. Question
220. You need to implement a solution that grants sales managers access to only the data relevant to them.
What should you include in the solution?
-
Question 66 of 78
66. Question
221. You combine data from the Sales_Region, Region_Manager, Sales_Manager, and Manager tables into a single table named Region.
Requirement:
Meet the executives’ reporting needs, which require viewing data by management structure.What should you do next?
-
Question 67 of 78
67. Question
222. You need to create a solution that meets the reporting requirements of the sales department.
Which DAX object should you create?
-
Question 68 of 78
68. Question
223. You need to resolve data quality issues in the existing environment related to sales amounts, ensuring that calculations exclude invalid values.
What should you do?
-
Question 69 of 78
69. Question
224. You need to create a calculated column that displays the month and year based on the reporting requirements.
Which DAX expression should you use?
-
Question 70 of 78
70. Question
225. You need to reduce the size of a Power BI dataset while still meeting all reporting requirements.
Which action should you take?
-
Question 71 of 78
71. Question
226. You need to design a Power BI data model that satisfies the reporting requirements, including analysis by different date contexts.
What should you do in Power BI Desktop?
-
Question 72 of 78
72. Question
227. You need to update a Power BI data model so that analysts can easily drill down in a visual from Business Unit to Product.
What should you create?
-
Question 73 of 78
73. Question
228. You need to build an On-Time Shipping report.
The report must include a visualization that clearly shows the percentage of late orders.Which type of visualization should you use?
-
Question 74 of 78
74. Question
229. You need to create a solution that satisfies the reporting requirements of the sales department, ensuring that calculations exclude invalid or negative sales values.
What should you create?
-
Question 75 of 78
75. Question
230. You need to make sure that the report data stays up to date and continues to meet the reporting requirements.
Constraint:
The solution must require minimal configuration and maintenance effort.What should you do?
-
Question 76 of 78
76. Question
231. You need to determine the minimum number of Power BI datasets required to support the reporting solution described in the scenario.
Which option meets the requirement?
-
Question 77 of 78
77. Question
232. You need to create a Power BI dataset to meet the requirements described in the scenario.
Which dataset mode should you use?
-
Question 78 of 78
78. Question
233. You need to configure secure access for sales department users to Power BI content.
Requirement:
The solution must meet security requirements and follow best practices for controlled distribution.What should you do?