
Assessment Summary
0 of 77 Questions completed
Questions:
Information

You have already completed the assessment before. Hence you can not start it again.
Assessment is loading…
You must sign in or sign up to start the assessment.
You must first complete the following:
Results
YOUR RESULTS
0 / 77 Questions Correct!
Time:
Time has elapsed
You have reached 0 of 0 point(s), (0)
Earned Point(s): 0 of 0, (0)
0 Essay(s) Pending (Possible Point(s): 0)
Categories
- Not categorized 0%


- 1
- 2
- 3
- 4
- 5
- 6
- 7
- 8
- 9
- 10
- 11
- 12
- 13
- 14
- 15
- 16
- 17
- 18
- 19
- 20
- 21
- 22
- 23
- 24
- 25
- 26
- 27
- 28
- 29
- 30
- 31
- 32
- 33
- 34
- 35
- 36
- 37
- 38
- 39
- 40
- 41
- 42
- 43
- 44
- 45
- 46
- 47
- 48
- 49
- 50
- 51
- 52
- 53
- 54
- 55
- 56
- 57
- 58
- 59
- 60
- 61
- 62
- 63
- 64
- 65
- 66
- 67
- 68
- 69
- 70
- 71
- 72
- 73
- 74
- 75
- 76
- 77
- Current
- Review
- Answered
- Correct
- Incorrect
-
Question 1 of 77
1. Question
1. You are working with a project management application that is fully hosted within Microsoft Teams. The application was built using Microsoft Power Apps.
You need to create a Power BI report that retrieves data directly from this application. Which Power BI connector should you use?
-
Question 2 of 77
2. Question
2. A sales report has already been published in Power BI. The report uses imported data from an Excel file stored in a SharePoint folder, and the model includes multiple existing measures.
You need to build a new Power BI report using the same data and measures, while keeping the work required to a minimum. Which data source should you connect to?
-
Question 3 of 77
3. Question
3. You loaded two Excel tables into Power Query: Customer and Address.
Customer includes:
Customer ID
Customer Name
Phone
Email Address
Address IDAddress includes:
Address ID
Address Line 1
Address Line 2
City
State/Region
Country
Postal CodeEach Customer ID is unique in the Customer table, and each Address ID is unique in the Address table.
You need to produce a single query with one record per customer, and each record must include the customer’s City, State/Region, and Country. What should you do?
-
Question 4 of 77
4. Question
4. You are developing a Power BI report using data from an Azure SQL database called erp1.
You load the following tables into the model:
Products (product catalog details)
Orders (order-level summary information)
Order Line Items (product ID, quantity, and pricing details per order)You need the report to support these analyses:
Trend reporting of orders over time, including a measure for total order amount
Analysis of orders by product characteristicsTo ensure the report visuals respond as quickly as possible, you want to reduce the work done at query time.
What should you do first?

-
Question 5 of 77
5. Question
5. A SharePoint Online site contains multiple document libraries. One of these libraries stores manufacturing reports as Excel workbooks, and every report follows the same table/layout structure.
In Power BI Desktop, you want to load only those manufacturing report files into a single table for analysis.
What should you do?
-
Question 6 of 77
6. Question
6. You are working with a CSV file that stores customer complaints. One of the columns, Logged, records the date and time when each complaint was submitted.
The values in the Logged column follow this format:
2018-12-31 at 08:59You want to analyze complaints by date in Power BI and take advantage of the built-in date hierarchy.
What should you do?
-
Question 7 of 77
7. Question
7. An Excel workbook is stored in a OneDrive folder. You need to load the workbook into a Power BI dataset.
The dataset must be able to support scheduled refresh in the Power BI service (powerbi.com).
Which two connectors can you use to connect to the file?
(Select two. Each correct option is a complete solution.) -
Question 8 of 77
8. Question
8. An Azure SQL database stores sales transaction records and is updated on a continuous basis.
You need to build reports that can identify potential fraud, and the reports must reflect new or changed data within five minutes of it being written to the database.
How should you configure the Power BI data connection?
-
Question 9 of 77
9. Question
9. A BI developer has built a Power BI dataflow that connects to tables in an on-premises SQL Server using DirectQuery. The Enhanced Dataflows Compute Engine is enabled.
You need to use this dataflow in a Power BI report, and the solution must:
Reduce reliance on online query processing
Provide fast calculations and quick visual rendering
Include only records from the current year, up to and including yesterdayWhat should you do?
-
Question 10 of 77
10. Question
10. You are trying to connect Power BI Desktop to a Cassandra database. When reviewing the available Get Data connectors, you notice that there is no dedicated Cassandra connector.
You need to choose an alternative connector that will allow Power BI to connect to the database.
Which connector should you use?
-
Question 11 of 77
11. Question
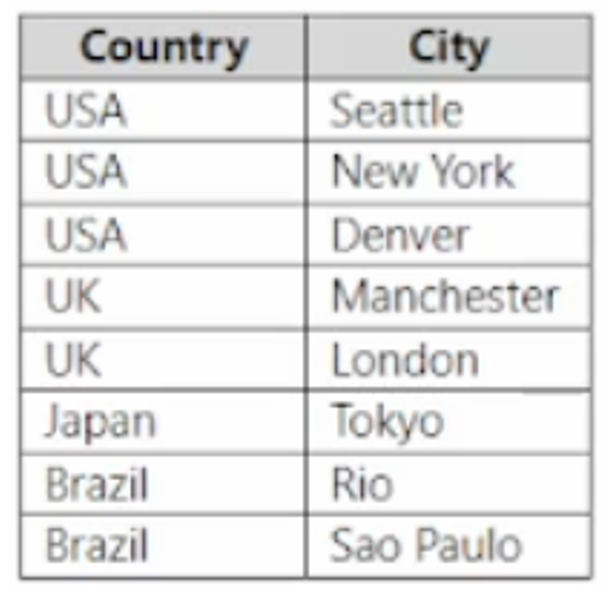
11. You are preparing a Country dimension table for use in a star schema.
The source data includes two columns: Country and City, with multiple cities listed under the same country.Your goal is to create a dimension table that contains only one row per country, with no duplicate country values.
Which two actions should you take to achieve this result?
Select two answers. Each correct answer represents part of the solution.
-
Question 12 of 77
12. Question
12. While running a query in Power Query Editor, you encounter the following error message:
Datasource.Error: Could not find file
Which two scenarios could cause this error to occur? Select two answers. Each correct option represents a valid cause.
-
Question 13 of 77
13. Question
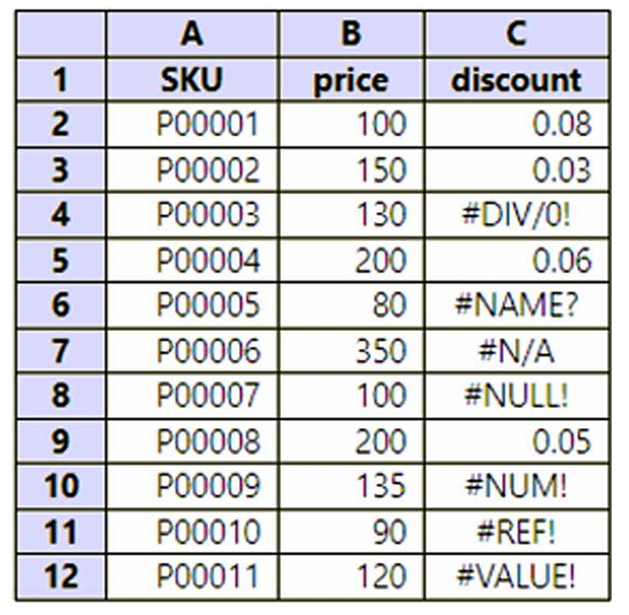
13. An Excel worksheet contains product data with the columns SKU, price, and discount.
Several rows in the discount column display error values (for example, calculation or reference errors).You need to clean the data using Power Query Editor so that:
Any error in the discount column is replaced with a value of 0.05
No rows are removed from the dataset
The solution requires minimal maintenance and configurationWhat should you do in Power Query Editor?
-
Question 14 of 77
14. Question
14. You’re working with a CSV that logs customer complaints. One column, Logged, stores both the date and time of each complaint in this format:
2018-12-31 at 08:59
You want to report on complaints by date and use Power BI’s built-in date hierarchy.
What should you do?
-
Question 15 of 77
15. Question
15. You load two tables from an Azure SQL database into Power Query: Order Header and Order Details. The two tables are related through a shared column called Order ID.
You want to create one query that combines both tables so that it includes the distinct columns from each table.
Which option should you choose in Power Query Editor?
-
Question 16 of 77
16. Question
16. A Power BI Desktop (PBIX) file imports data from an Excel workbook located on a local network file share. You are informed that the Excel file has been moved to a different folder or location.
You need to update the PBIX file so that it connects to the new file location.
Which three actions can you use to update the connection successfully? Select three answers. Each correct answer represents a complete solution.
-
Question 17 of 77
17. Question
17. Northwind Traders is a specialty food importer that has recently adopted Power BI to improve reporting and analytics.
Currently, the sales team depends on the IT department to create reports using SQL Server Reporting Services (SSRS). This process is slow and often results in reports that do not fully meet business needs.
Existing Environment
Data is sourced from:
An Azure SQL Database containing sales, product, supplier, category, order, and employee data
A daily-exported Excel file stored in SharePoint Online
Historical data must be retained for the current year and the previous three yearsReporting Requirements
The organization needs the following reports:
Top Customers
Top Products
On-Time ShippingThese reports must support filtering by time period, sales region, and product category, and must provide fast interaction performance for users.
Technical and Security Requirements
A single dataset must support all reports
All reports must be hosted in one Power BI workspace
Data must be refreshed daily and be current by 7:00 AM Pacific Time
The data model should be as small as possible while still meeting reporting needs
Row-level security (RLS) must be applied to restrict sales users to their assigned regionsAccess is controlled using Azure AD security groups
Question
You need to design the semantic model for this solution.
Which storage mode should you use for the tables in the semantic model? -
Question 18 of 77
18. Question
18. You want to build a bug tracking dashboard in Power BI Desktop using data from Azure DevOps Analytics.
You need to set up a connector that can:
Authenticate to Azure DevOps
Work with Analytics views
Apply filtering at the source (in the cloud)Which connector should you choose?
-
Question 19 of 77
19. Question
19. Note: This question belongs to a scenario-based question set. Each question proposes a different solution approach. Some questions may have more than one valid solution, while others may not.
Once you submit your answer, you cannot return to this question.You are working with a DirectQuery Power BI semantic model connected to a data source that includes a case-sensitive column.
After connecting to the model, you notice that the column contains errors and undefined values.
You consider addressing the issue by implicitly converting the column values to the required data type.
Does this approach resolve the problem?
-
Question 20 of 77
20. Question
20. Note: This item is part of a multi-question scenario. Each question proposes a different fix for the same situation. After you submit your response, you won’t be able to revisit this question.
You have a DirectQuery Power BI semantic model connected to a data source that includes a case-sensitive column.
After connecting, you notice the model contains errors and unrecognized/undefined values.
Proposed solution: Switch the semantic model to a different mode (change the model mode).
Does this solution resolve the issue?
-
Question 21 of 77
21. Question
21. Note: This question is part of a scenario-based series. Each item suggests a different possible fix. Once you answer, you can’t return to it.
A data source includes a column where values are case-sensitive (uppercase/lowercase differences matter).
Your Power BI semantic model uses DirectQuery.After connecting, you notice the model shows errors and unrecognized/undefined values.
Proposed solution: Standardize the text casing (for example, convert everything to upper or lower case) in the source query or in Power Query Editor.
Does this solution achieve the goal?
-
Question 22 of 77
22. Question
22. Note: This question is part of a multi-question scenario. Each question proposes a different potential fix. Once you submit your answer, you cannot return to this question.
You are working with a Power BI semantic model that uses DirectQuery.
The underlying data source includes a column with case-sensitive values.After connecting to the model, you notice errors and undefined values in the data.
Proposed solution: Add an index column and standardize the text casing (for example, convert all values to upper or lower case) in the data source.
Does this solution resolve the issue?
-
Question 23 of 77
23. Question
23. An Excel workbook is stored in a OneDrive location. You need to load this file into a Power BI semantic model.
The semantic model must support scheduled refresh in the Power BI service (powerbi.com).
Which two data connectors can you use to connect to the file and meet this requirement?
Select two answers. Each correct option represents a complete solution.
-
Question 24 of 77
24. Question
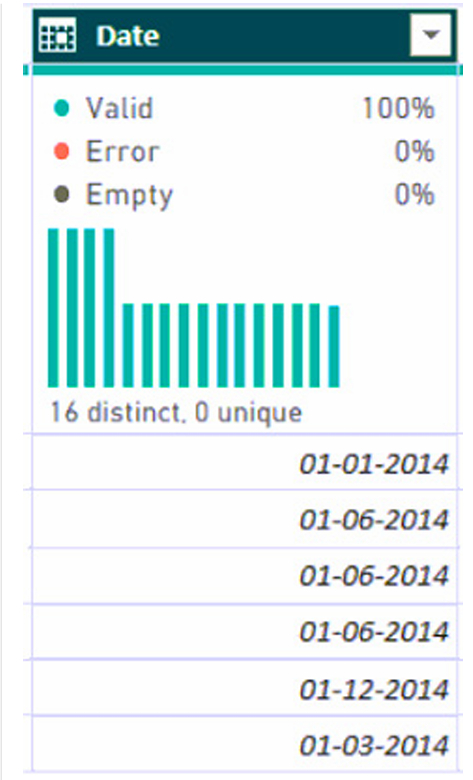
24. While reviewing data in Power Query Editor, you examine a column named Date that contains full date values (day, month, and year), as shown in the preview.
You want to modify this column so that it contains only the year value.
The solution should require the least possible configuration and maintenance.What should you do?
-
Question 25 of 77
25. Question
25. In Power BI Desktop, you import two tables: Customer and Contacts.
Customer includes:
Customer_Name
Customer ID
WebsiteContacts includes:
Contact ID
Contact Email
Contact Name
Customer NameThe Contacts table is populated through an online contact form, and the entries may contain inconsistencies (for example, spelling differences, extra spaces, or variations in formatting) because the input data is not cleaned.
You need to merge the Customer and Contacts tables.
What should you do?
-
Question 26 of 77
26. Question
26. You have a Power BI Desktop report named Report1 that connects to an Azure SQL Database.
Another user, User1, wants to create their own Power BI report using the same data source. You want to make it easier for User1 to connect to that data source without recreating the connection details manually.
Which type of file should you create to simplify the data source connection?
-
Question 27 of 77
27. Question
27. You are building a Power BI semantic model (Model1) that connects to an Azure SQL database (DB1).
The semantic model must reflect data changes within two minutes after updates occur in the database.Which connectivity mode should you use?
-
Question 28 of 77
28. Question
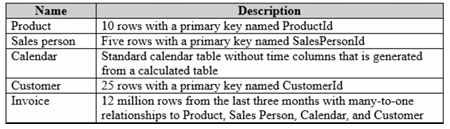
28. A Power BI report contains a very large Invoice table (12 million rows from the last three months) and several small dimension tables (Product, Sales Person, Calendar, Customer).
For the past three days, dataset refresh has failed with this error:
“You have reached the maximum allowable memory allocation for your tier.”You must:
Fix the refresh failure caused by memory limits
Keep query response times fast for report usersWhat is the best solution?
-
Question 29 of 77
29. Question
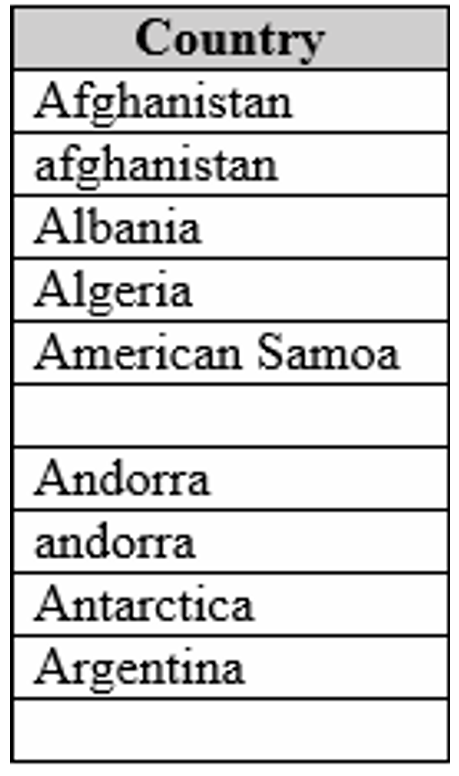
29. You have a table called DIMCountries that includes a column named Country, as shown in the exhibit.
Some country names appear more than once because they use different letter casing (for example, uppercase and lowercase).You plan to use DIMCountries as a dimension table in a Power BI report.
To ensure that the Country column contains only one unique entry per country, which two actions should you apply to the Country column?
Select two.
-
Question 30 of 77
30. Question
30. You are building a report in Power BI Desktop and have loaded a dataset that contains a free-text column called col1.
You want to analyze how often different text lengths occur in col1 (for example, how many values have 5 characters, 10 characters, and so on).
The solution must not increase the size of the data model.What should you do?
-
Question 31 of 77
31. Question
31. You manage several Power BI reports used by the HR department.
The datasets behind these reports use row-level security (RLS) to restrict data by sales region.Each sales region has an HR manager, and you must ensure that:
HR managers can view and interact only with data from their own region
HR managers cannot modify report layouts (for example, edit visuals or structure)What is the best way to provide access to the reports for the HR managers?
-
Question 32 of 77
32. Question
32. You need to give a user permission to add other users to a Power BI workspace.
At the same time, you must follow the principle of least privilege, meaning the user should receive only the minimum permissions required to perform this task.Which workspace role should you assign?
-
Question 33 of 77
33. Question
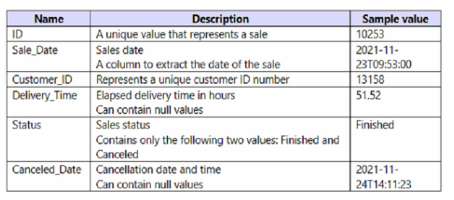
33. You have a Power BI query named Sales that loads several columns, including dates and status fields.
Key details:
Users only analyze completed (Finished) sales
Users only need the date portion of the sales date (not the time)
You want to reduce query load times
The solution must not change the analytical resultsWhich two actions should you take to meet these requirements?
Select two.
-
Question 34 of 77
34. Question
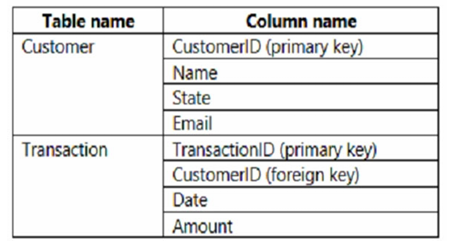
34. You are creating a Power BI report to analyze customer transactions.
The source database includes two tables:Customer – contains one record per customer
Transaction – contains multiple records per customer, representing individual transactionsYou import both tables into Power BI.
Which relationship type and direction should you configure between the two tables?
-
Question 35 of 77
35. Question
35. You are using a custom connector that retrieves email metadata for the past year, including the following fields:
ID
From
To
Subject
Body
Has AttachmentsThe dataset contains more than 10 million records.
You create a Power BI report to analyze email communication patterns between employees (who emails whom).You must ensure that:
Report users cannot read the email contents
The size of the data model is kept as small as possibleWhat should you do?
-
Question 36 of 77
36. Question
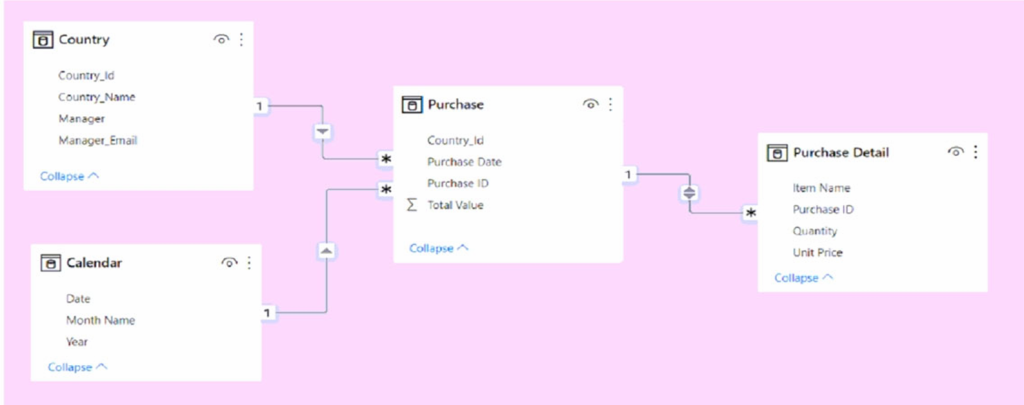
36. You have a Power BI semantic model like the one shown in the diagram.
Each manager is responsible for exactly one country.You need to implement row-level security (RLS) with the following goals:
Managers can view only the data for their own country
The solution should use the fewest possible RLS rolesWhich two actions should you take to meet these requirements?
Select two.
-
Question 37 of 77
37. Question
37. You have a Power BI report with a PBIX size of 550 MB, published to an App workspace in shared capacity (powerbi.com).
The report uses an Import dataset with a single fact table containing 12 million rows, refreshed twice daily (8:00 AM and 5:00 PM).The report has one page that includes:
15 AppSource custom visuals
10 built-in visualsUsers report that the page is slow to load and feels laggy when interacting with visuals.
What is the best recommendation to improve report performance?
-
Question 38 of 77
38. Question
38. A Power BI data model includes three tables: Orders, Date, and City.
There is a one-to-many relationship from Date → Orders and from City → Orders.The model has two RLS roles:
Role1 applies this filter:
City[State Province] = “Kentucky”Role2 applies this filter:
Date[Calendar Year] = 2020If a user is assigned to both Role1 and Role2, what data will the user be able to see in a report?
-
Question 39 of 77
39. Question
39. This question is part of a scenario-based series. Each question proposes a different solution that may or may not meet the stated objective.
You are building a Power BI data model that includes a very large SQL Server table named Order containing over 100 million rows.
During development, you only want to work with a small sample of the data from the Order table.
Proposed solution:
You import the entire table into Power Query Editor and then apply a filter step to limit the rows.Does this solution meet the goal?
-
Question 40 of 77
40. Question
40. This question is part of a scenario-based series. Each question proposes a different solution that may or may not achieve the stated objective.
You are developing a Power BI data model that includes a very large SQL Server table named Order with more than 100 million rows.
During development, you want to import only a sample of the data from the Order table to work more efficiently.
Proposed solution:
You create a DAX expression that uses the FILTER function to limit the data.Does this solution meet the goal?
-
Question 41 of 77
41. Question
41. This question is part of a scenario-based series where each proposed solution must be evaluated independently.
You are developing a Power BI data model that includes a very large SQL Server table named Order with over 100 million rows.
During the development phase, you want to import only a subset (sample) of the data from the Order table to improve performance and speed up development.
Proposed solution:
You modify the SQL query used to retrieve the data by adding a WHERE clause to limit the rows returned.Does this solution meet the goal?
-
Question 42 of 77
42. Question
42. You are working with a Power BI data model similar to the one shown in the exhibit.
The Departments table contains four departments.You must make sure that each user can view data only for their own department.
What is the correct approach?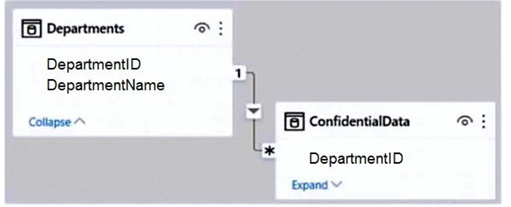
-
Question 43 of 77
43. Question
43. You are designing a Power BI Desktop report that includes two tables, and row-level security (RLS) is already configured on both of them.
You need to create a relationship between these tables so that:
Bidirectional cross-filtering works correctly, and
RLS rules are fully respected and enforced across both tables.What should you do?
-
Question 44 of 77
44. Question
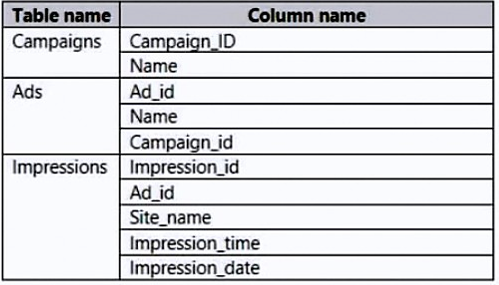
44. You have several tables, including an Impressions table that grows by about 30 million rows every month.
You need to build an ad analytics model that can:
Show daily impression counts by campaign and site_name
Support reporting for the last 12 months
Keep the data model as small as possibleWhich two actions should you take?
-
Question 45 of 77
45. Question
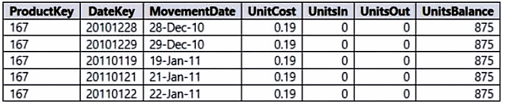
45. You import a Power BI dataset that contains the following tables:
Date
Product
Product InventoryThe Product Inventory table is very large, containing 25 million rows.
It is related to:
Date via DateKey
Product via ProductKeyYou want to reduce the size of the data model while preserving all analytical value (that is, without losing any meaningful information needed for reporting).
What should you do?
-
Question 46 of 77
46. Question
46. This question is part of a scenario-based series. Each question evaluates whether a proposed solution meets a specific goal.
You are building a Power BI data model that includes a very large SQL Server table named Order with more than 100 million rows.
During development, you want to work with only a sample of the data from the Order table to improve performance and speed up modeling.
Proposed solution:
You apply a report-level filter that restricts the data based on the order date.Does this solution meet the goal?
-
Question 47 of 77
47. Question
47. This question is part of a scenario-based series. Each proposed solution must be evaluated independently.
You have a Power BI report that imports data from an Azure SQL database, including:
A Date table
A Sales tableThe Sales table contains multiple date foreign keys:
Due Date
Order Date
Delivery DateYou need to enable time-based analysis of sales using all three date columns.
Proposed solution:
You create inactive relationships between the Sales table and the Date table for each date foreign key.Does this solution meet the goal?
-
Question 48 of 77
48. Question
48. This question is part of a scenario-based series. Each question evaluates whether a proposed solution meets the stated requirement.
You have a Power BI report that imports data from an Azure SQL database, including:
A Date table
A Sales tableThe Sales table contains multiple date foreign keys:
Due Date
Order Date
Delivery DateYou need to enable time-based analysis of sales using all three date columns.
Proposed solution:
In Power Query Editor, you rename the Date query to Due Date, then reference it twice to create separate queries for Order Date and Delivery Date.Does this solution meet the goal?
-
Question 49 of 77
49. Question
49. This question is part of a scenario-based series. Each question evaluates whether a proposed solution satisfies the stated requirement.
You have a Power BI report that imports data from an Azure SQL database, including:
A Date table
A Sales tableThe Sales table contains multiple date foreign keys:
Due Date
Order Date
Delivery DateYou must support time-based sales analysis using all three date columns.
Proposed solution:
From the Fields pane, you rename the Date table to Due Date, then use DAX to create two additional calculated tables for Order Date and Delivery Date.Does this solution meet the goal?
-
Question 50 of 77
50. Question
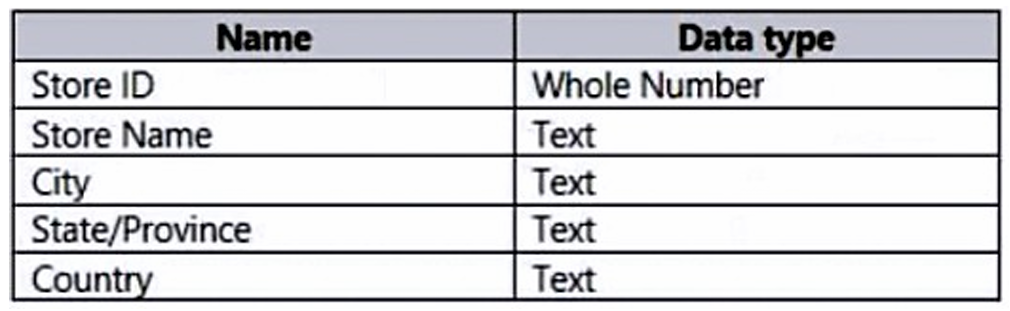
50. You are building a Power BI data model that includes a table named Store with location-related fields.
You plan to create a map visual that displays store locations and allows users to drill down geographically from:
Country
to State/Province
to CityWhat should you do to ensure that Power BI correctly interprets and maps these location fields?
-
Question 51 of 77
51. Question
51. You’re building a Power BI data model for a report.
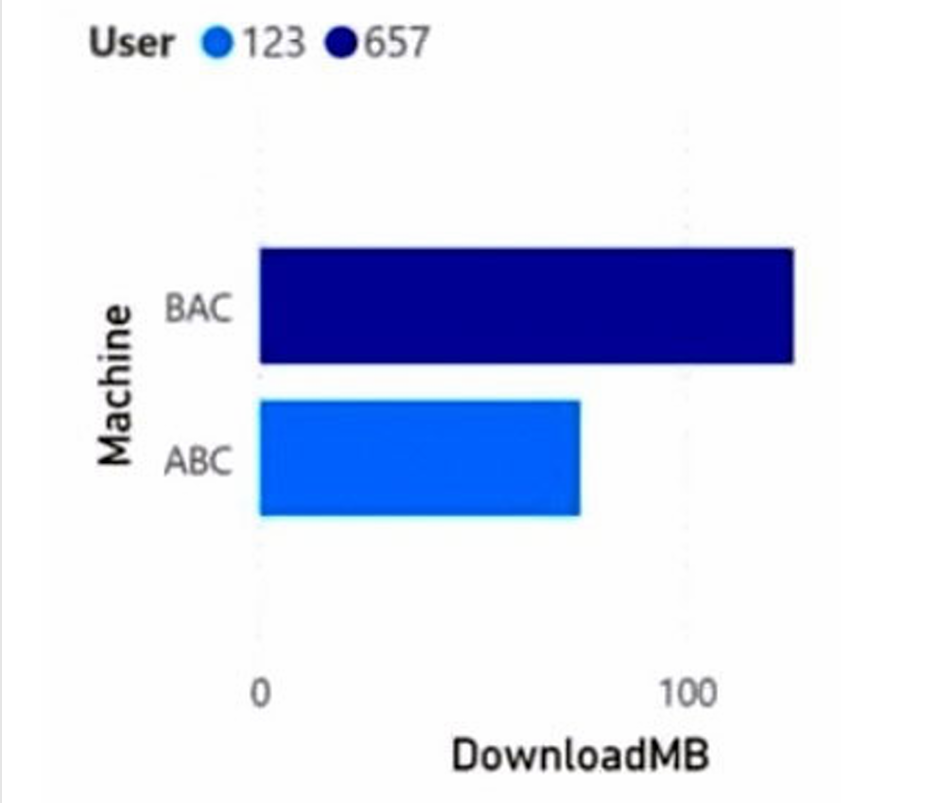
Your source data includes a single combined column called Machine-User (formatted as shown in the table).
You need to produce a clustered bar chart like the one in the exhibit, which requires Machine and User to be treated as separate fields.
What should you do?
-
Question 52 of 77
52. Question
52. You are working with a Power BI report that imports a date table and a sales table from an Azure SQL database.
The sales table includes the following date fields
Due Date
Order Date
Delivery DateYou need to enable time-based analysis of sales using all three date fields.
Proposed solution:
Create measures that use the USERELATIONSHIP DAX function to filter sales using the active relationship between the sales table and the date table.Does this solution meet the requirement?
-
Question 53 of 77
53. Question
53. You are working with a Power BI report created for the procurement team.
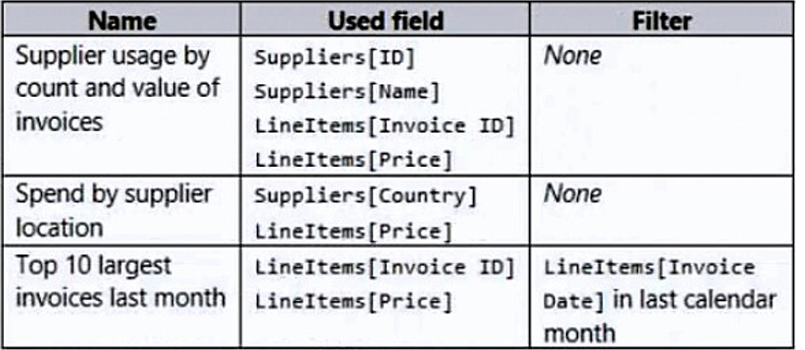
The report uses data from multiple tables, including Suppliers and LineItems, which are linked by a one-to-many relationship using ID and Supplier ID.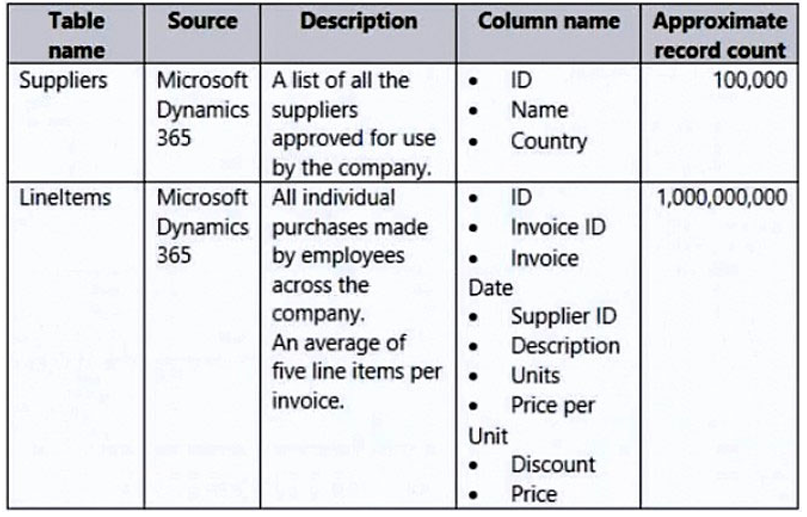
Several visuals in the report depend on this data.
You want to reduce the overall dataset size while ensuring that the existing visuals continue to work exactly as they do now.What action should you take?
-
Question 54 of 77
54. Question
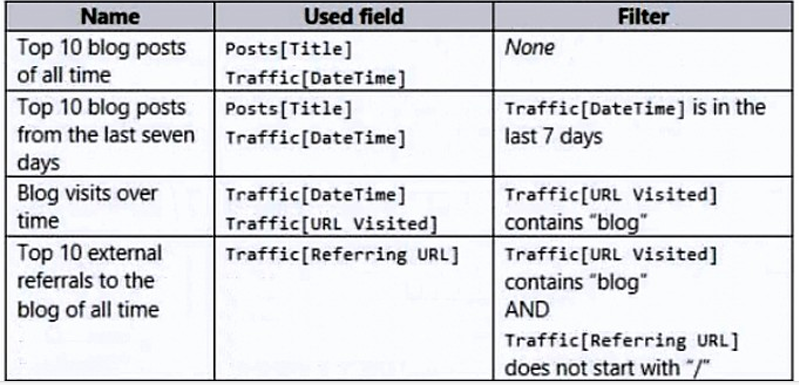
54. You are working on a Power BI report for the marketing team that analyzes blog website traffic. The report uses data from two tables: Posts and Traffic.
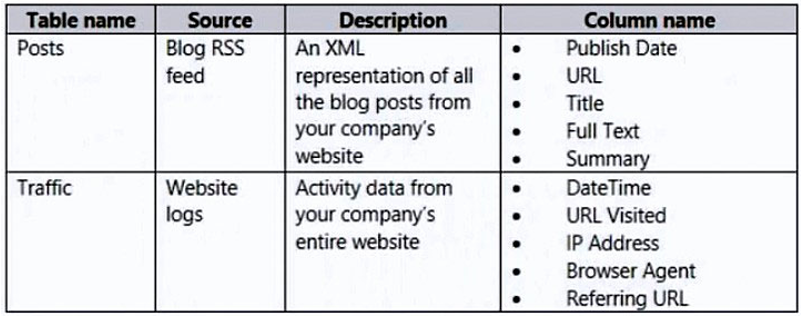
A one-to-many relationship exists between Posts[URL] and Traffic[URL Visited]. The report includes several visuals based on this data, but the dataset refresh process is taking too long.
You need to update the Posts and Traffic queries to improve refresh performance.
Which two actions should you take to reduce the load time? Each correct answer represents part of the solution.
-
Question 55 of 77
55. Question
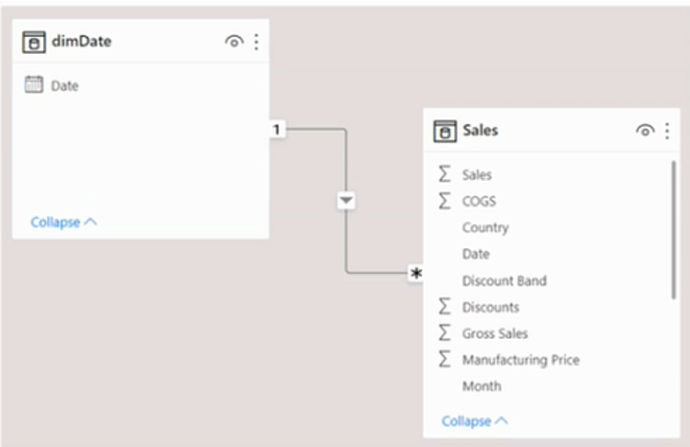
55. You are working with a Power BI data model like the one shown in the exhibit.
The Sales table stores daily sales records covering the past five years up to the current date.
You want to create a measure that returns total sales for March 2021 when March 2022 is selected in the report.
Which DAX expression should you use?
-
Question 56 of 77
56. Question
56. You are using Power BI Desktop to load data from a Microsoft SQL Server database.
While the data is loading, an error message appears indicating a problem with the query execution.
You need to fix the issue so the data can load successfully.
Which two actions can resolve the problem? Each correct answer represents a complete solution.

-
Question 57 of 77
57. Question
57. This question is part of a scenario-based series. Each question proposes a different solution that may or may not satisfy the stated requirements.
Once you answer this question, you cannot return to it.
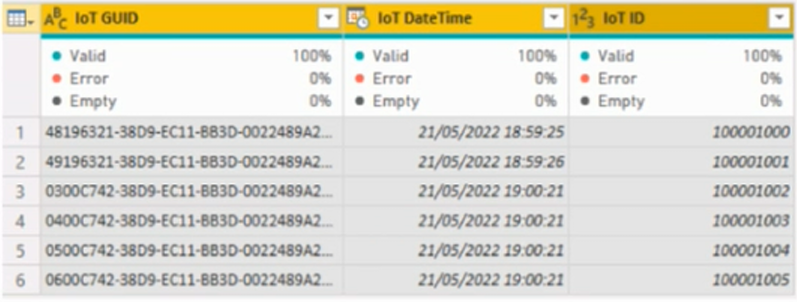
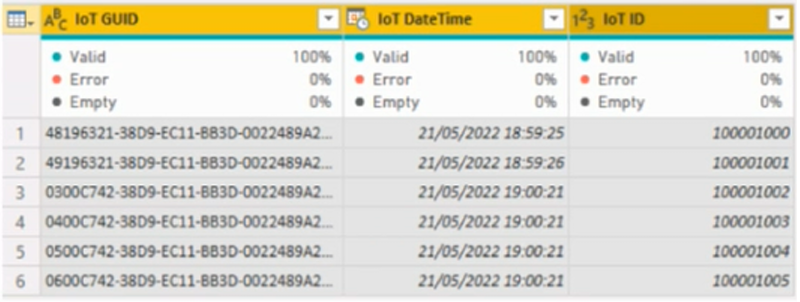
In Power Query Editor, you are reviewing the data profile shown in the exhibit.
The IoT GUID and IoT ID columns contain unique values for every row.
You need to analyze IoT events by hour and by day of the year, while also improving dataset performance.
Proposed solution:
You split the IoT DateTime column into two separate columns: Date and Time.Does this solution meet the requirement?
-
Question 58 of 77
58. Question
58. This question is part of a scenario-based series. Each question suggests a different solution that may or may not satisfy the stated objectives.
After answering this question, you will not be able to revisit it.
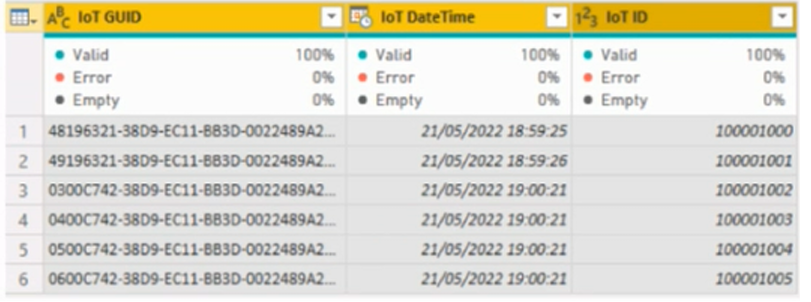
In Power Query Editor, you are reviewing the data profile shown in the exhibit.
The IoT GUID and IoT ID columns both contain unique values for every row.
You need to analyze IoT events by hour and by day of the year, and the solution must improve dataset performance.
Proposed solution:
You remove the IoT GUID column and keep the IoT ID column.Does this solution meet the requirement?
-
Question 59 of 77
59. Question
59. This question belongs to a series based on the same scenario. Each question proposes a different solution that may or may not satisfy the stated objectives.
Once you submit your answer, you cannot return to this question.
In Power Query Editor, you are reviewing the data profile shown in the exhibit.
Both the IoT GUID and IoT ID columns contain unique values for each row.
You need to analyze IoT events by hour and by day of the year, and the solution must improve the performance of the dataset.
Proposed solution:
You change the IoT DateTime column to use the Date data type.Does this solution meet the requirement?
-
Question 60 of 77
60. Question
60. You are working with a Power BI report that has a PBIX size of 550 MB and is published to an App workspace in shared capacity on PowerBI.com.
The report uses an imported dataset containing a single fact table with 12 million rows. The dataset refreshes twice daily at 8:00 AM and 5:00 PM.
The report consists of one page with 15 AppSource visuals and 10 built-in visuals.
Users report that the visuals load slowly when they open and interact with the report.You need to recommend a way to improve report performance.
What should you recommend?
-
Question 61 of 77
61. Question
61. You have a CSV file that stores user complaints. One of the columns is named Logged, which records the date and time when each complaint was logged.
The Logged column is stored in the following text format:
2018-12-31 at 08:59
You need to analyze complaints by date and use Power BI’s built-in date hierarchy (Year, Quarter, Month, Day).
What should you do?
-
Question 62 of 77
62. Question
62. Note: This question is part of a multi-question scenario. Each question suggests a different solution that may or may not meet the requirements. Once you answer, you can’t go back to review it.
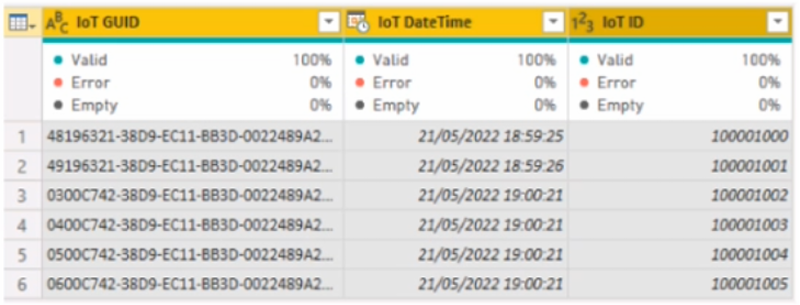
In Power Query Editor, you review a dataset (shown in an exhibit). The columns IoT GUID and IoT ID contain values that are unique for every single row.
You need to:
Analyze IoT events by hour and by day of the year
Use a solution that improves dataset performanceProposed solution:
You add a custom column that combines (concatenates) IoT GUID + IoT ID into one column, then you delete the original IoT GUID and IoT ID columns.Does this solution meet the goal?
-
Question 63 of 77
63. Question
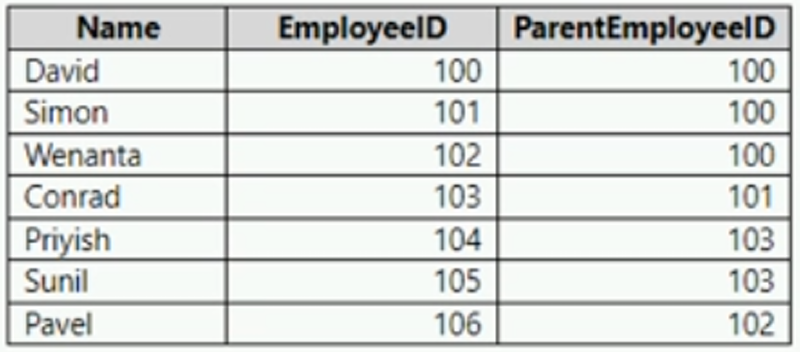
63. You have a Power BI data model with a table named Employee.
Each record represents an employee, and the ParentEmployeeID column identifies that employee’s direct manager.The organizational structure forms a hierarchy where:
Each employee reports to one manager
All reporting chains eventually lead to the CEO at the top
You need to create a calculated column that returns the number of hierarchy levels from each employee up to the CEO.
Which DAX expression should you use?
-
Question 64 of 77
64. Question
64. You have a Microsoft Power BI report with the following characteristics:
The PBIX file size is 550 MB
The report is published to an App workspace in shared capacity on PowerBI.com
The report uses an Import mode dataset
The dataset contains one fact table with 12 million rows
The dataset refreshes twice daily at 08:00 and 17:00The report has one page with:
15 AppSource visuals
10 built-in (default) visualsUsers report that the visuals load slowly when opening and interacting with the report
You need to recommend a solution that will improve report performance.
What should you recommend?
-
Question 65 of 77
65. Question
65. You are using Power Query Editor to preview a query that contains sales order data with the following columns:
Tax Amount
Sales Order ID
Freight Amount
Subtotal Amount
Total Item QuantityKey details:
Sales Order ID uniquely identifies each order
Subtotal Amount and Total Item Quantity are always populated
Tax Amount and Freight Amount may be null when an order has no associated chargeYou need to prepare the data so you can calculate the following monthly metrics:
Average item quantity per order
Average freight amount per order
Maximum item quantity per orderHow should you modify the query?
-
Question 66 of 77
66. Question
66. You have a Power BI data model with a table named Employees that includes the following columns:
Employee ID (unique identifier)
First Name
Last Name
Department
SalaryYou need to create a DAX measure that calculates the average salary of all employees who work in the Sales department.
Which DAX expression should you use?
-
Question 67 of 77
67. Question
67. You have a Power BI data model that includes a table named Employees with the following columns:
Employee Name
Email Address
Start Date
Job TitleYou are configuring dynamic row-level security (RLS).
The security rules must meet these requirements:
Each user can see only their own employee record
The DAX expression must work correctly in both Power BI Desktop and the Power BI serviceWhich table filter expression should you use?
-
Question 68 of 77
68. Question
68. You have a Power BI data model that imports data from a Microsoft Excel file.
Using Power Query, you load a query that includes renamed columns and custom columns.Later, when you try to refresh the query, you receive the following error message:
Expression.Error: The column ‘Category’ of the table wasn’t found.Which two of the following could have caused this error?
-
Question 69 of 77
69. Question
69. You have a Power BI data model with a table named Sales that includes the following columns:
Order Line ID
Product ID
Unit Price
Order ID
QuantityImportant details:
Each Order ID represents one order
An order can contain multiple order lines
Each order line within an order has a different Product ID
You need to create a DAX measure that correctly returns the number of orders.Which DAX expression should you use?
-
Question 70 of 77
70. Question
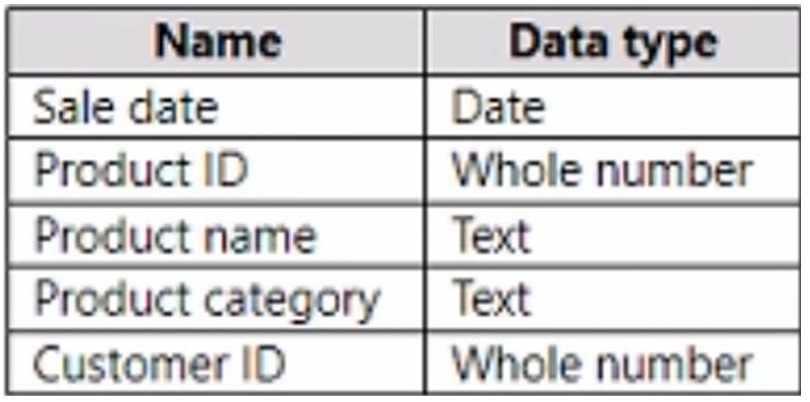
70. In Power Query Editor, you have a query named Sales Data that contains sales-related columns.
You need to create two new queries from this source:
Product Dimension
Sales FactThe solution must:
Minimize maintenance effort
Minimize the size of the datasetWhich two actions should you perform?
-
Question 71 of 77
71. Question
71. You have a Power BI data model with a table named Date that contains the following columns:
Date
Fiscal Year
Fiscal Quarter
Month Name
Calendar Year
Week Number
Month Number
Calendar QuarterYou need to create a calculated table derived from the Date table.
The calculated table must include only unique combinations of the following fields:
Calendar Year
Calendar Quarter
Calendar MonthWhich DAX function should you include in the calculated table definition?
-
Question 72 of 77
72. Question
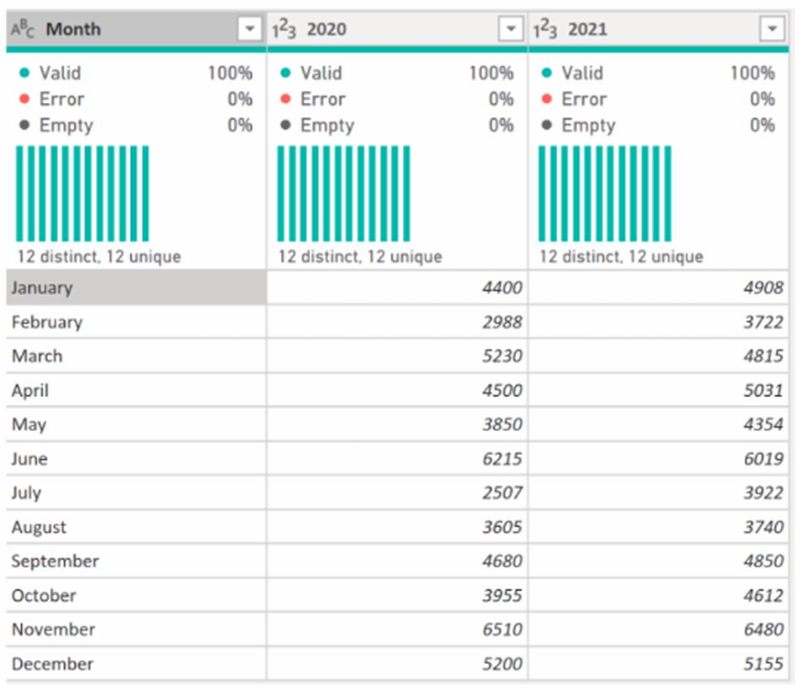
72. You are using Power Query Editor to import and preview sales data for the years 2020 and 2021 from a Microsoft Excel file (as shown in the exhibit).
The data is currently structured with years as separate columns.
You need to reshape the data so that the query outputs exactly three columns:
Month
Sales
YearWhat should you select in Power Query Editor to achieve this result?
-
Question 73 of 77
73. Question
73. Note: This question is part of a scenario-based series. Each question proposes a different solution that may or may not satisfy the stated requirements. Once answered, you cannot return to review this question.
You have a Power BI report that imports data from an Azure SQL Database.
The model includes:
A Date table
A Sales tableThe Sales table contains three date foreign key columns:
Due Date
Order Date
Delivery DateYou need to enable sales analysis over time using all three dates simultaneously.
Proposed solution:
Rename the existing Date table to Due DateCreate two calculated date tables using DAX:
Order Date
Delivery DateCreate active relationships between the Sales table and each of the three date tables
Does this solution meet the goal?
-
Question 74 of 77
74. Question
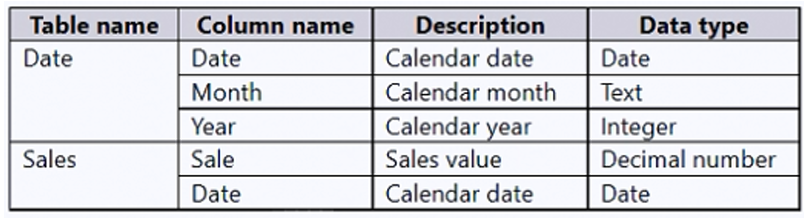
74. You have a Power BI data model that includes:
A Date table related to a Sales table by the Date column
An existing measure:
Total Sales = SUM(Sales[Sale])You need to create another measure named Previous Quarter that returns the total sales for the quarter immediately before the currently selected period.
Which DAX calculation should you use?
-
Question 75 of 77
75. Question
75. You have a Power BI data model with two tables:
Sales
DateThe Sales table contains the following measures:
Order Quantity
Product Cost
Sales AmountYou need to create the visual shown in the exhibit, which displays these measures together.
In which section of the Fields well should you place the measures?

-
Question 76 of 77
76. Question
76. You are reviewing a Power BI data model that includes a calculated table defined by the following DAX expression:
ProductList = INTERSECT(ProductsGroupA, ProductsGroupB )
You need to determine which rows are returned in the ProductList table.
Which rows will be included?
-
Question 77 of 77
77. Question
77. Note: This question is part of a scenario-based series. Each question proposes a different solution that may or may not meet the stated goals. Once you answer, you cannot return to review this question.
You have a Power BI report that imports data from an Azure SQL Database.
The model includes:
A Date table
A Sales tableThe Sales table contains three date foreign key columns:
Due Date
Order Date
Delivery DateYou need to enable analysis of sales over time using all three date columns.
Proposed solution:
You create measures that use the USERELATIONSHIP() DAX function to activate the inactive relationships between the Sales table and the Date table when required.Does this solution meet the goal?